Supply User Manual ENG -> 5. Warehouse -> 5.17 LU-SU4303: Management of Expiry Dates
LU-SU4303: Management of Expiry Dates.
C. HOW TO CHECK EXPIRATION OF KITS COMPONENTS
D. HOW TO PRODUCE A PERIODICAL FORECAST REPORT
Supply User Manual ENG -> 5. Warehouse -> 5.17 LU-SU4303: Management of Expiry Dates
C. HOW TO CHECK EXPIRATION OF KITS COMPONENTS
D. HOW TO PRODUCE A PERIODICAL FORECAST REPORT
Supply User Manual ENG -> 5. Warehouse -> 5.16 LU-SU4302: Stock Inventory Reports -> J. EXPORT STOCK & PIPE REPORT (HQ ONLY)
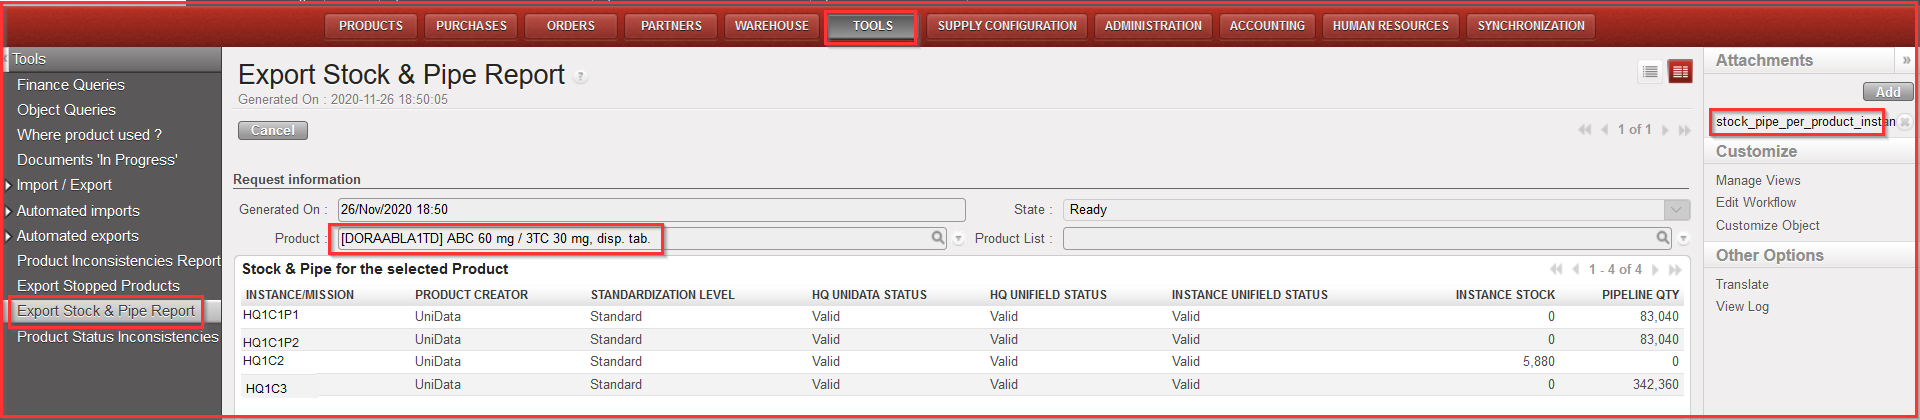
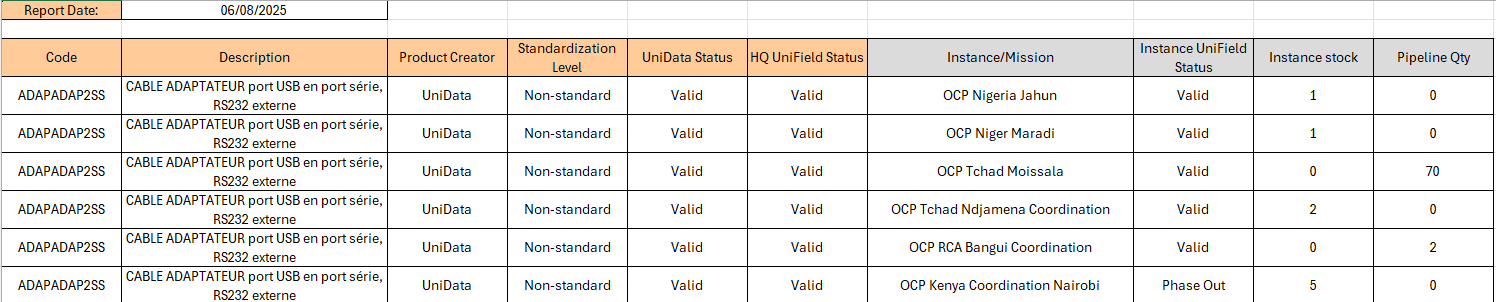
This report aims at displaying in which instance/s an individual product or a list of products is/are in Stock or in Pipe throughout the whole OC (it can be generated for example before proceeding to a BN/ED mass update). Therefore, the report can only be generated at HQ level.
The results give visibility of: Product Code, Description, Product Creator, Standardization level, UD status, UF status, Instances (name), Instance stock (qty) and Pipeline quantity (reminder: pipeline is calculated starting from a Validated PO line).
Report can be generated on screen or on Excel ( only on Excel for Product list).
Go to: Tools / Tools / Export Stock & Pipe Report
|
|
|
Export Stock & Pipe Report – on screen report (for 1 product) |
|
|
|
Export Stock & Pipe Report – excel export |
Supply User Manual ENG -> 5. Warehouse -> 5.16 LU-SU4302: Stock Inventory Reports -> I. PRODUCTS SITUATION REPORT
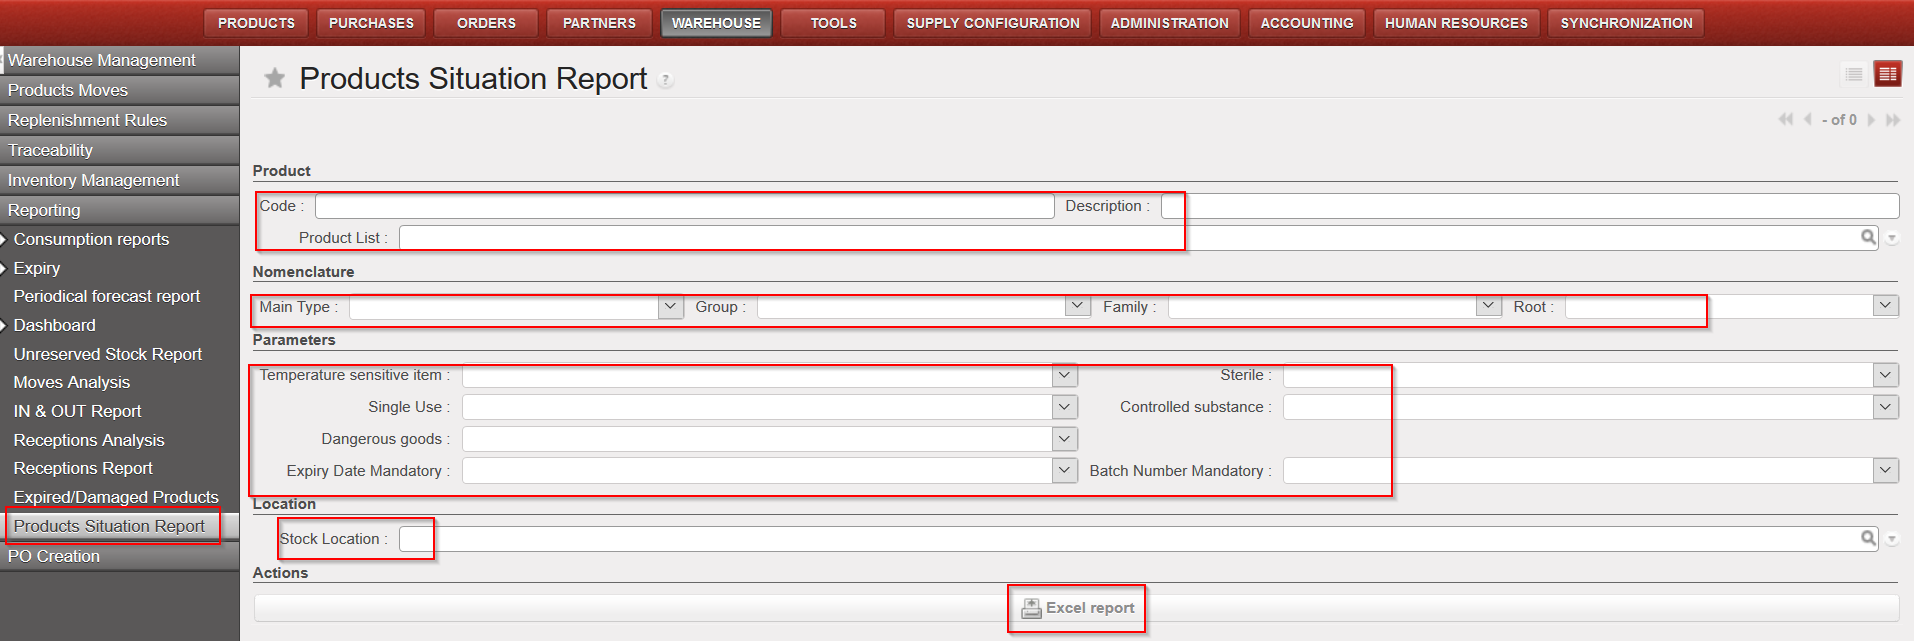
This report enables user to see the Real, Available and Virtual Stock as well as AMC and FMC for specific products with some refined filtering options, on products attributes for instance.
Go to: Warehouse / Reporting / Products Situation report
3. Click on “Excel report”
|
|
|
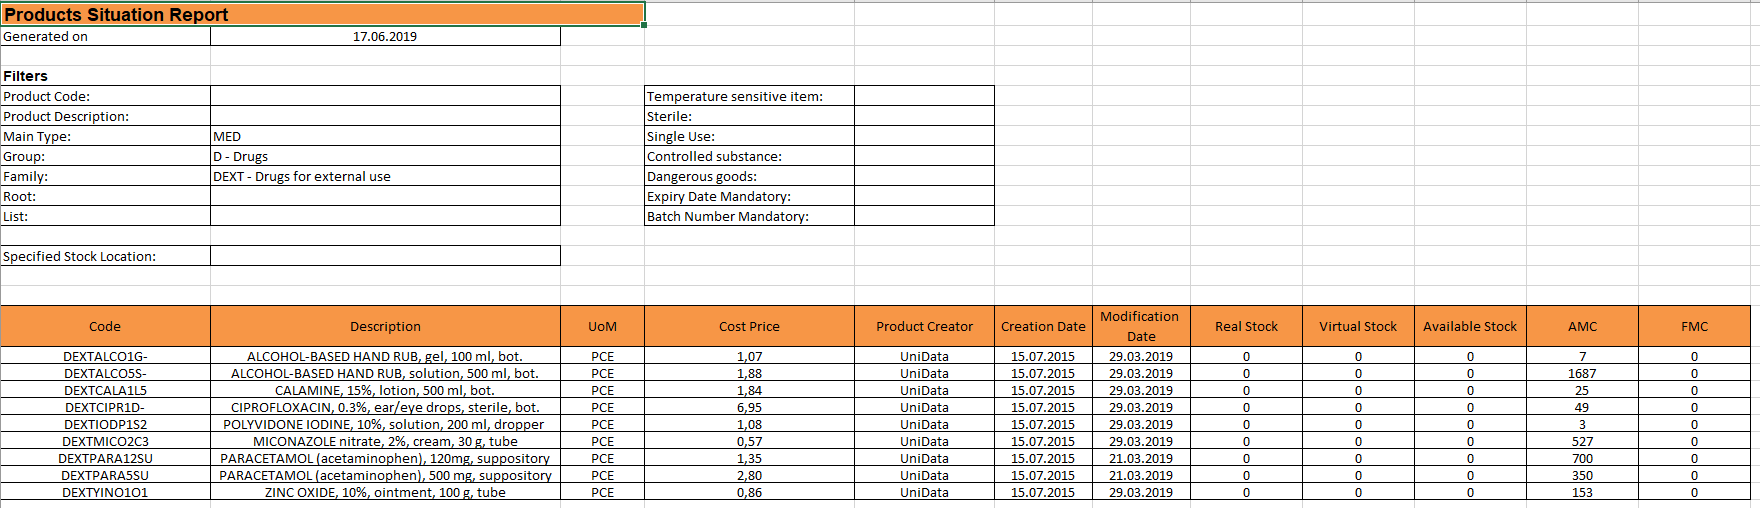
Products Situation report |
|
|
Please note that Real, Virtual and Available stock are calculated per location selected while AMC and FMC are always for whole instance.
If no location is selected then the Real, Virtual and Available stock will be for “MED/LOG” locations as per product form sheet.
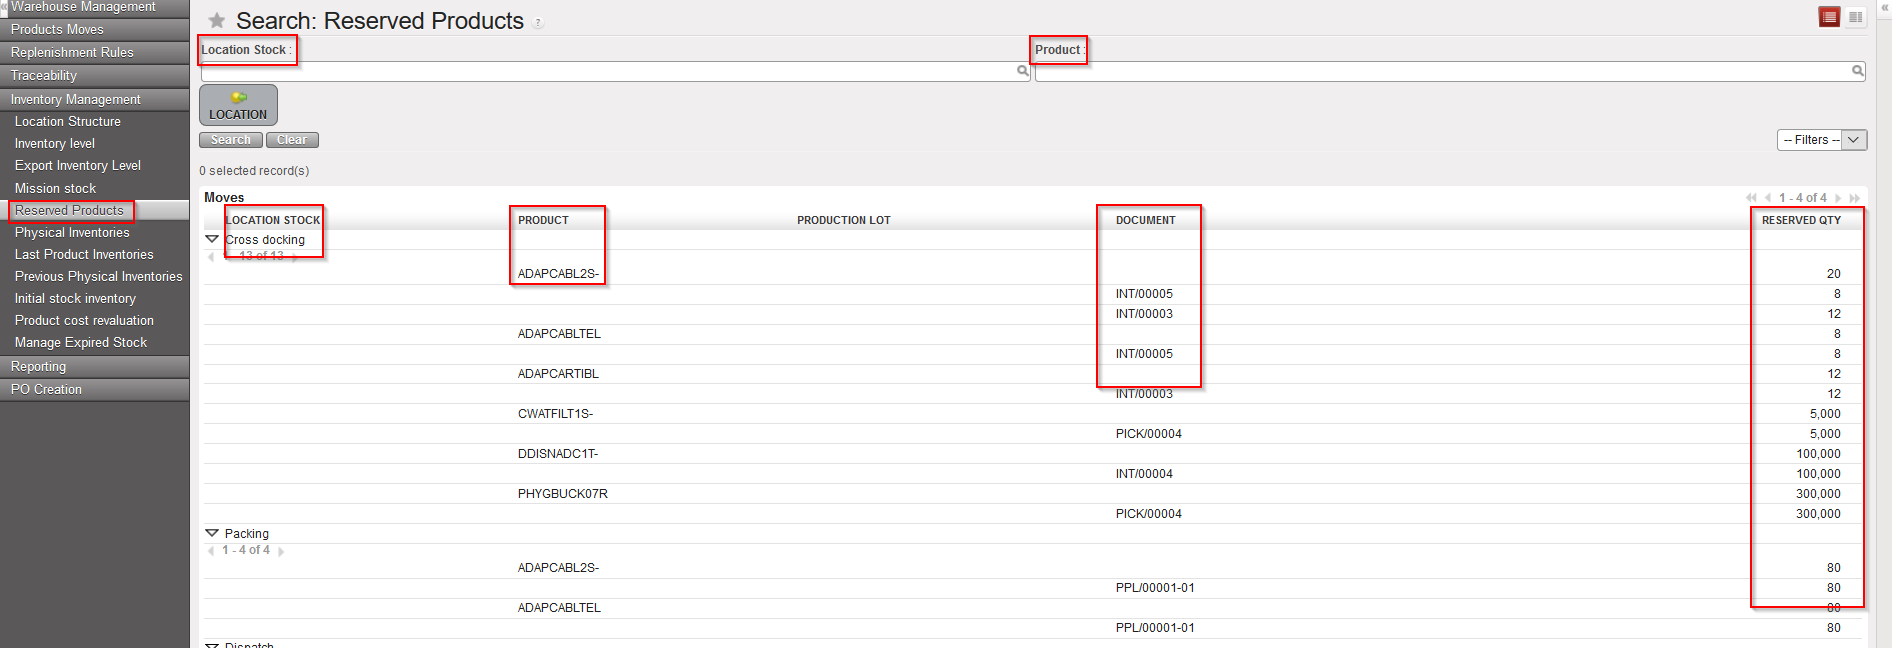
Supply User Manual ENG -> 5. Warehouse -> 5.16 LU-SU4302: Stock Inventory Reports -> H. RESERVED PRODUCTS REPORT
UniField allows you to check the stock levels for products which are allocated to different document: (OUT;Pick; INT; PPL and SHIP). Note that this report will not show the available stock.
Go to: Warehouse / Inventory Management / Reserved Products
Filter can be set on “Location” or on “Product”.
The report displays the Location, Product and Reference of the Document on which products are allocated.
|
|
|
Reserved Products |
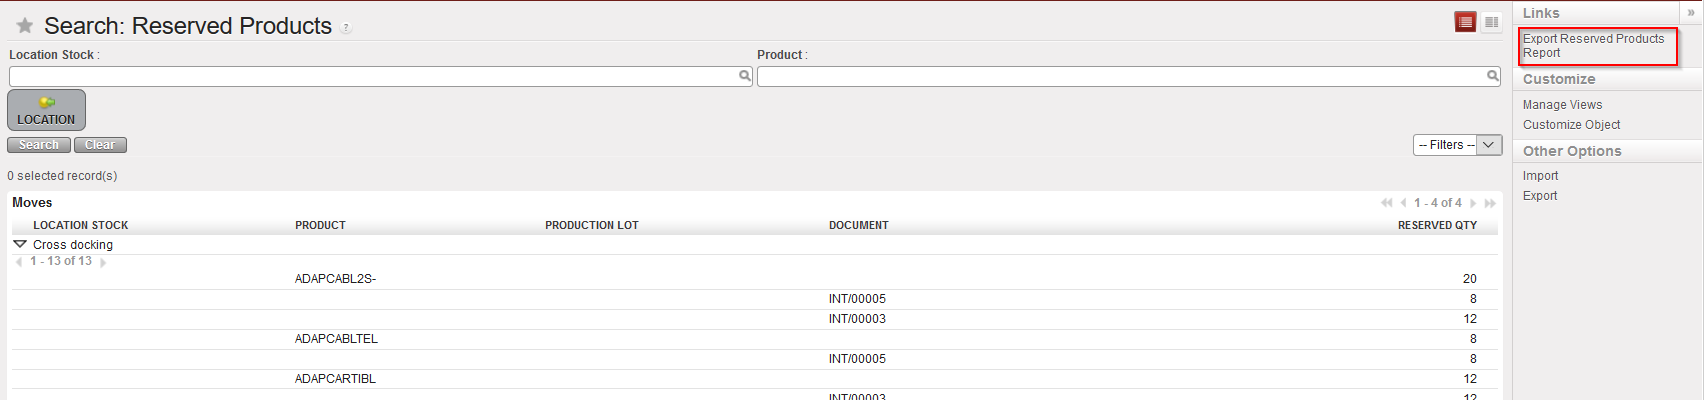
The report can also be Exported to an Excel file.
|
|
|
Link to generate reserved Stock Report in Excel |
|
|
|
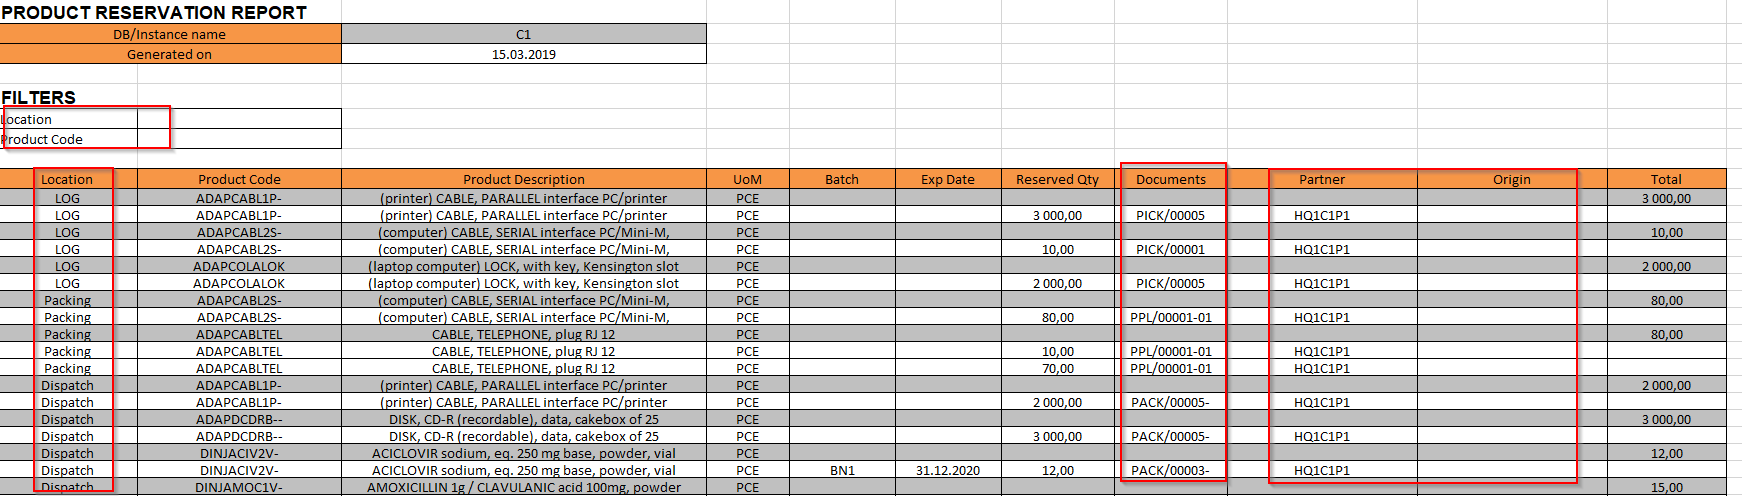
Reserved Stock Report in Excel |
Please note that the “Partner” field is for FO while the “Origin” field is for requesting location of IRs.
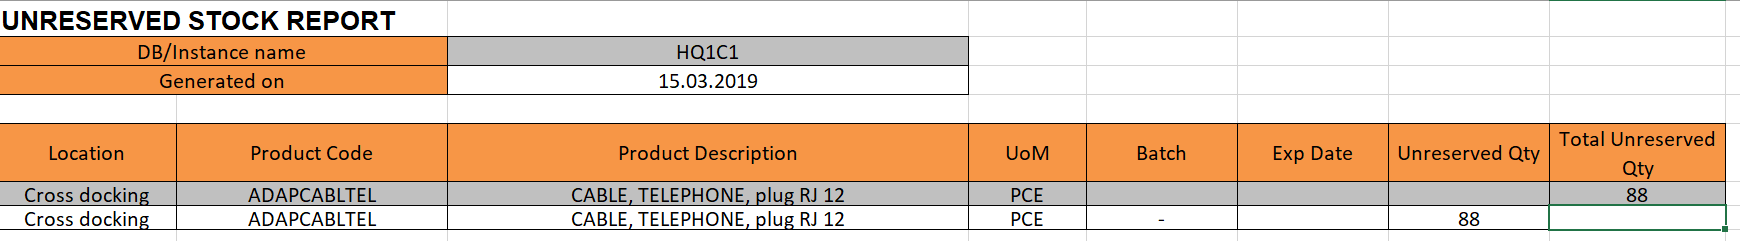
Supply User Manual ENG -> 5. Warehouse -> 5.16 LU-SU4302: Stock Inventory Reports -> G. UNRESERVED STOCK REPORT
UniField allows you to check the stock levels in “Cross Docking” location for products that are not reserved; that is to say that these products have most certainly been Cancelled from a PICK or an OUT document (and sent to Cross Docking). This report is therefore supposed to help with the stock cleaning process.
Go to: Warehouse / Reporting / Unreserved Stock Report
|
|
|
Unreserved Stock Report |
The report will display the products with their BN/ED, if any, and their Quantity.
Supply User Manual ENG -> 5. Warehouse -> 5.16 LU-SU4302: Stock Inventory Reports -> F. STOCK BY LOCATION
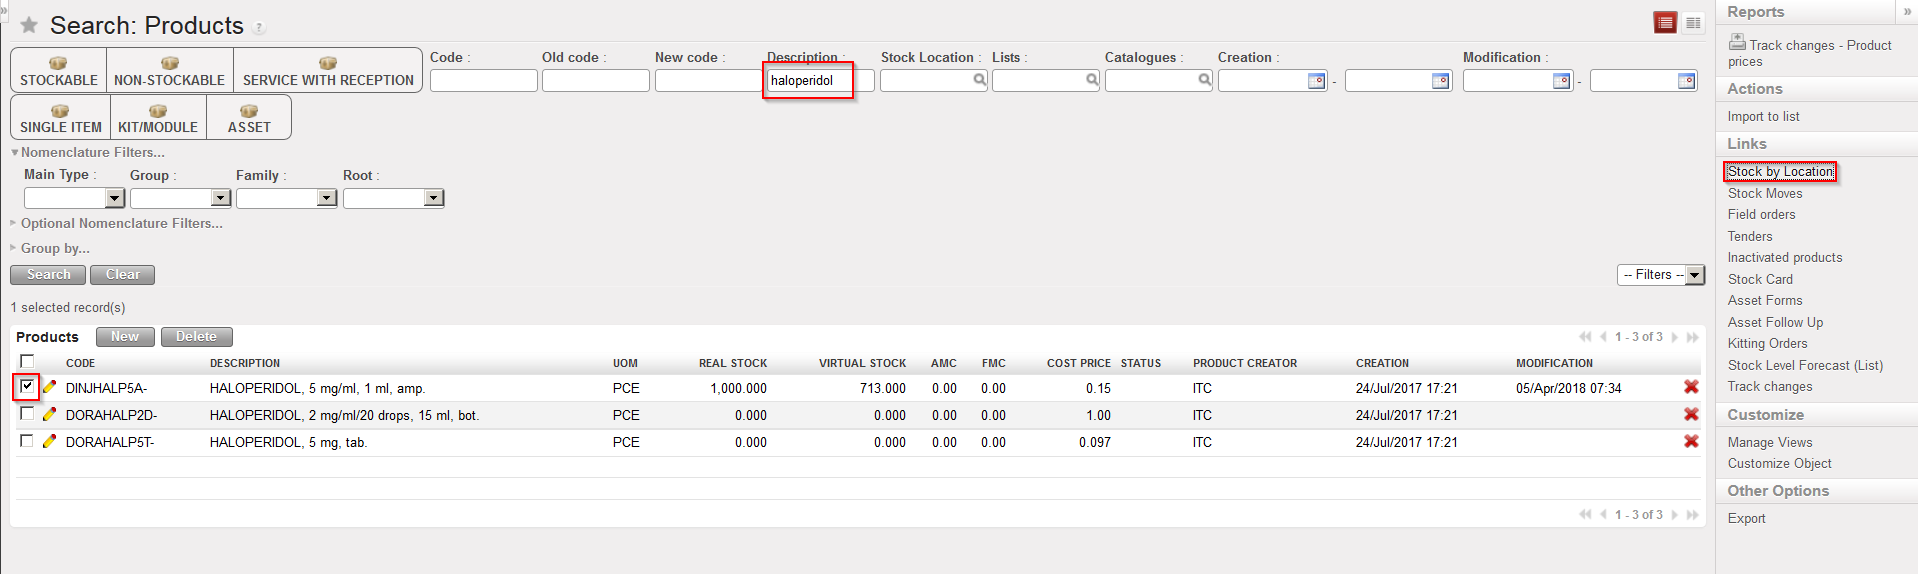
UniField allows you to check the stock levels in all locations for a given product.
Go to: Products / Products / Products
|
|
|
Stock by Location |
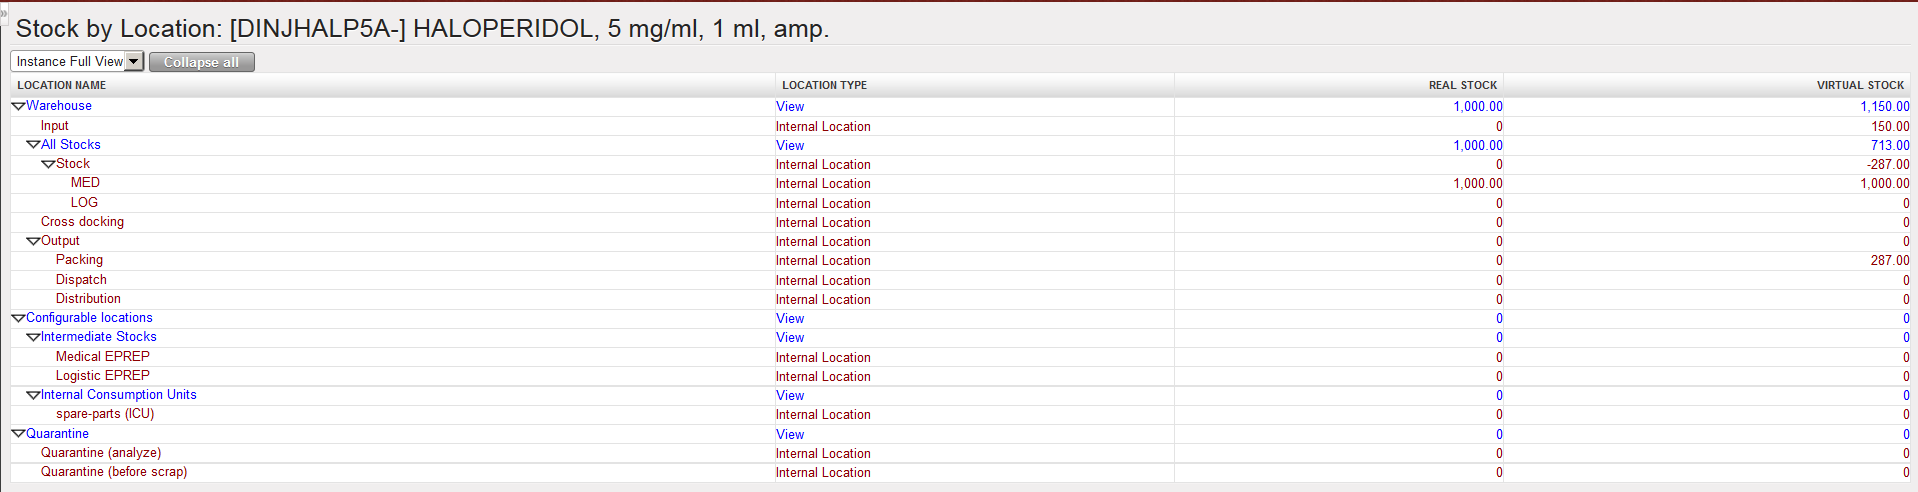
4. In the “Stock by Location” screen which opens, click on the “Expand all” button.
|
|
|
Stock by Location |
The real and virtual stock levels of the selected product in each internal location of the instance are displayed.
Note that locations belonging to the “Instance Full View” are displayed. You may change and select the view “Partner Locations” or “Virtual Locations” if needed.
Supply User Manual ENG -> 5. Warehouse -> 5.16 LU-SU4302: Stock Inventory Reports -> E. VIRTUAL STOCK LEVELS
In UniField, you will often hear about the notions of real stock, virtual stock and available stock.
Understanding these concepts will help you to understand how the system is actually working.
The real stock is the actual stock level currently present in a location (or in several locations).
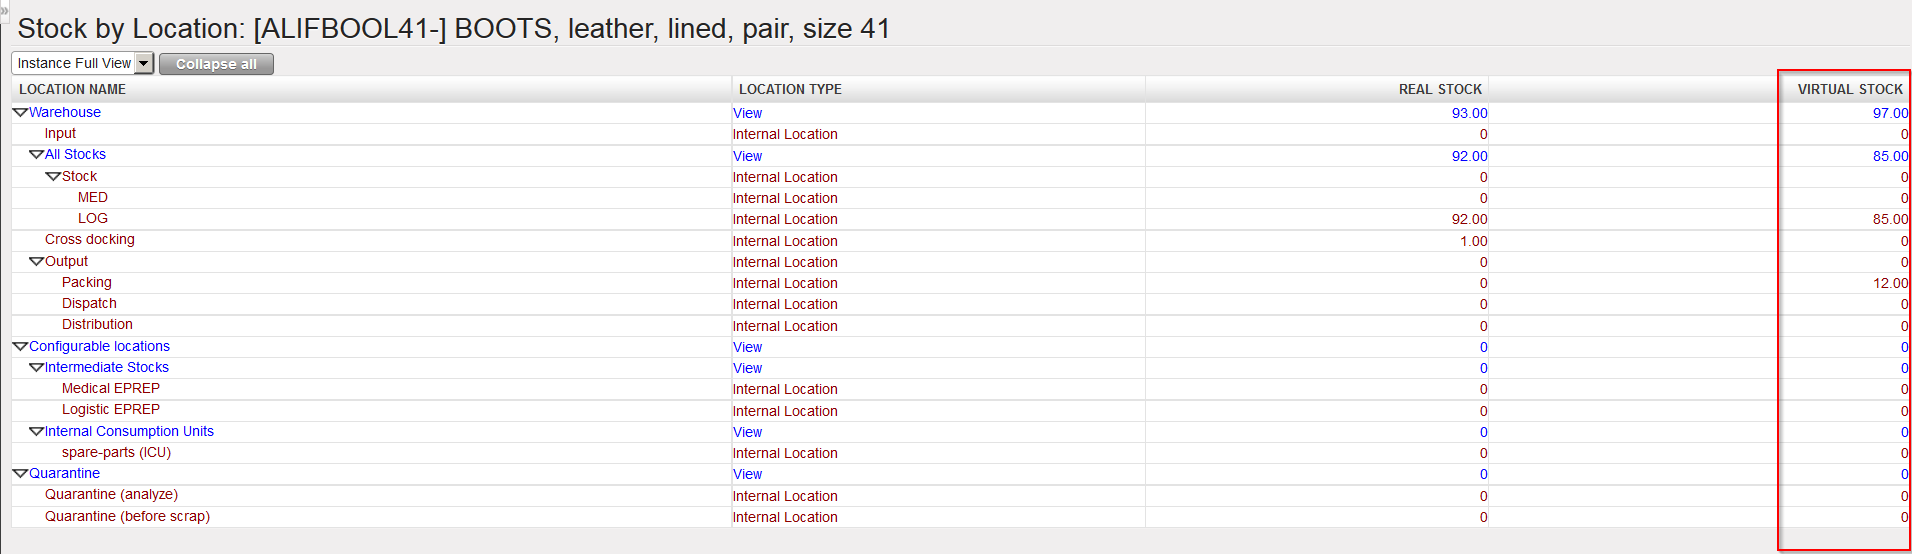
The virtual stock may be better understood if you think about a future stock.
A formula may help to understand: virtual stock = real stock + pipe line – reservation.
Note that as a movement always has a source and a destination location, all these documents will always impact 2 virtual stock levels in 2 different locations. The impact will be negative for the source location and positive for the destination location.
The virtual stock level gives a “snapshot” of how the stock is likely to evolve in the future, based on the transactions already registered in the system.
Virtual and real stock levels can be seen in the Stock by Location screen (as explained in the next section):
|
|
|
Stock by Location |
Supply User Manual ENG -> 5. Warehouse -> 5.16 LU-SU4302: Stock Inventory Reports -> D. INVENTORY LEVEL
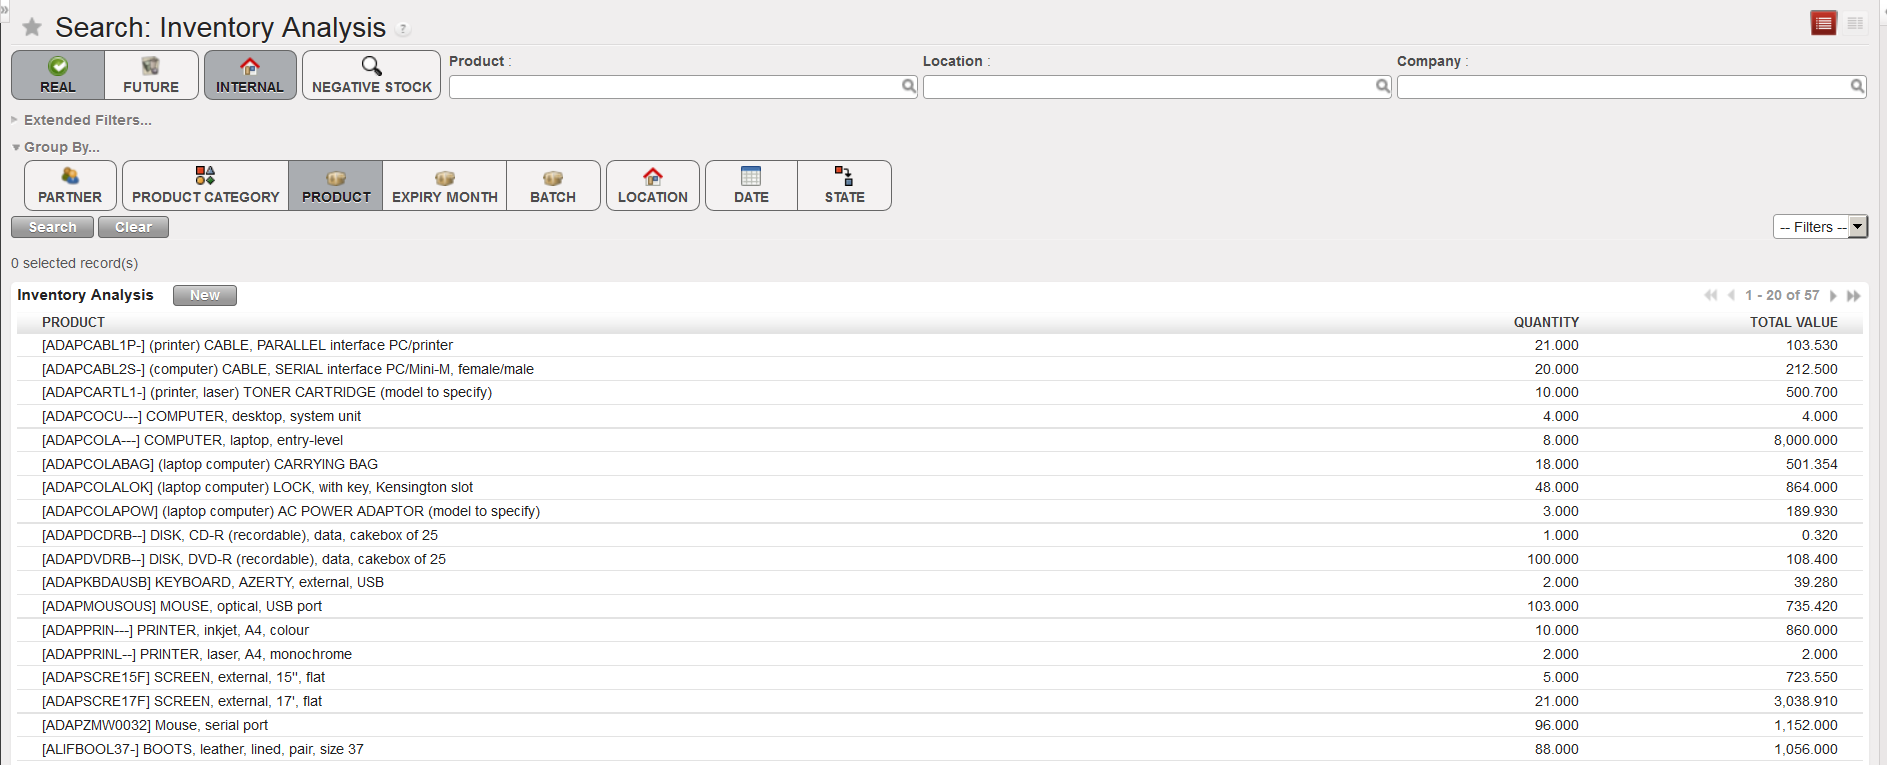
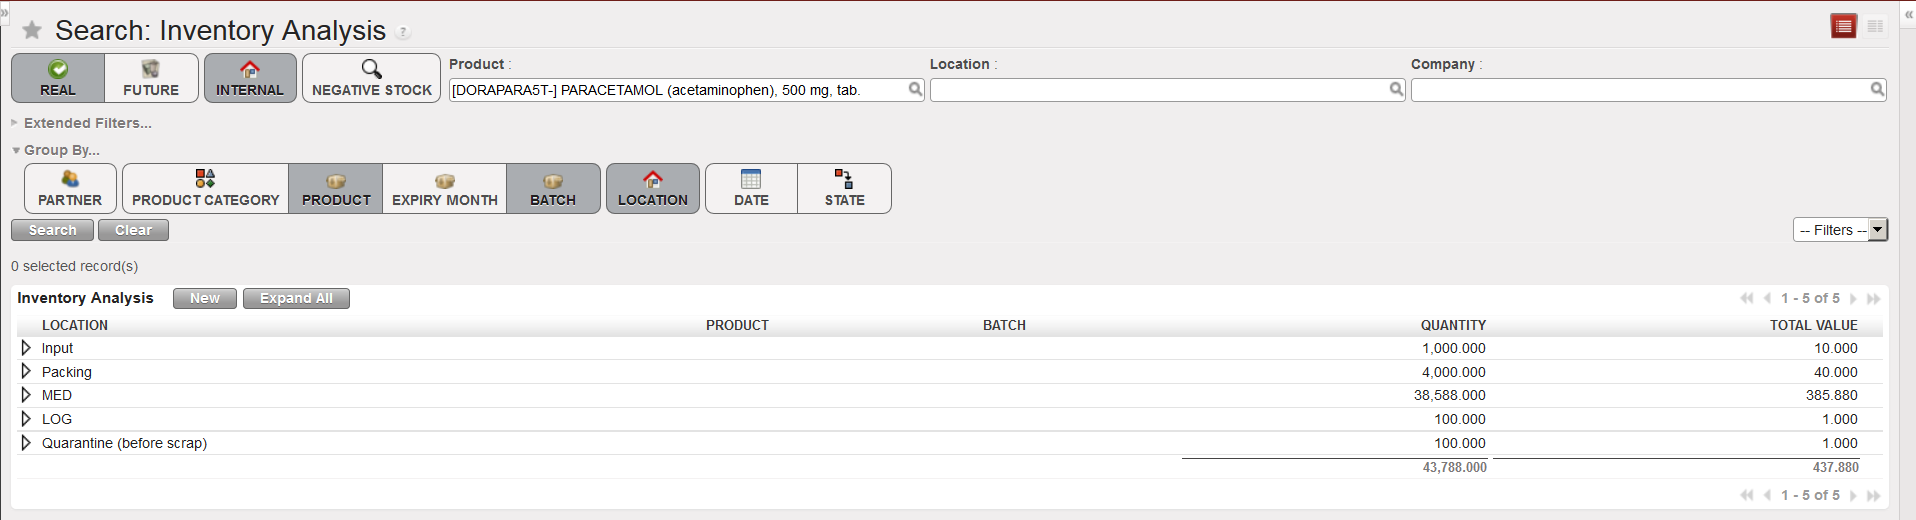
This functionality offers similar information than the “Export Inventory Level” functionality but provides an on-screen report. Filters and “Group by” options allow to decide more precisely which data should be selected and how results should be showed.
Go to: Warehouse / Inventory Management / Inventory level
|
|
|
Inventory Level |
You may use the filters and the “Group by” options to refine the data selection and design the report as you wish. In the action menu, the “Export” option allows exporting result to Excel.
|
|
|
Inventory Level |
Supply User Manual ENG -> 5. Warehouse -> 5.16 LU-SU4302: Stock Inventory Reports -> C. EXPORT INVENTORY LEVEL
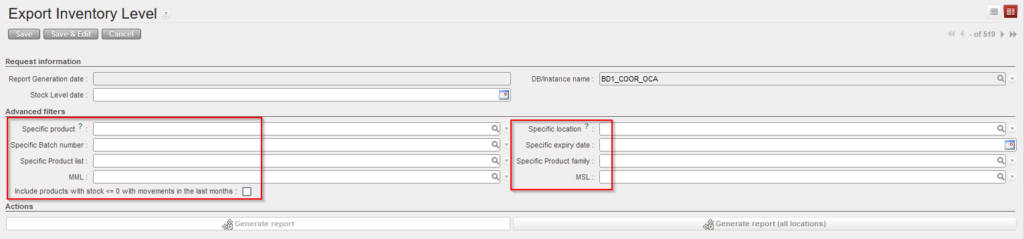
The “Export Inventory Level” functionality allows you to export to Excel the stock levels of an instance either by filtering on specific criteria such as product, batch, location or having a full view of your instance stock with all the locations displayed.
Depending on your choice, you will have two types of reports: the “Stock Inventory Global View” report or the “Stock Inventory Location View” report.
The Stock Inventory Global View displays the real stock level of each product/batch in each internal location and the total real stock level in all these locations.
The Stock Inventory Location View displays the real stock level of each product/batch in the selected location and the real stock level of each product (total of all batches) in the selected location.
One significant improvement that has been added to this export is that it can be generated in the past which allow user to have the stock level at a specific date.
Also it is now possible to filter the results in order to have as well the products <= 0 which had movements in the last X months.
Go to: Warehouse / Inventory Management / Export Inventory Level
|
|
|
Export Inventory Level – Global View Report |
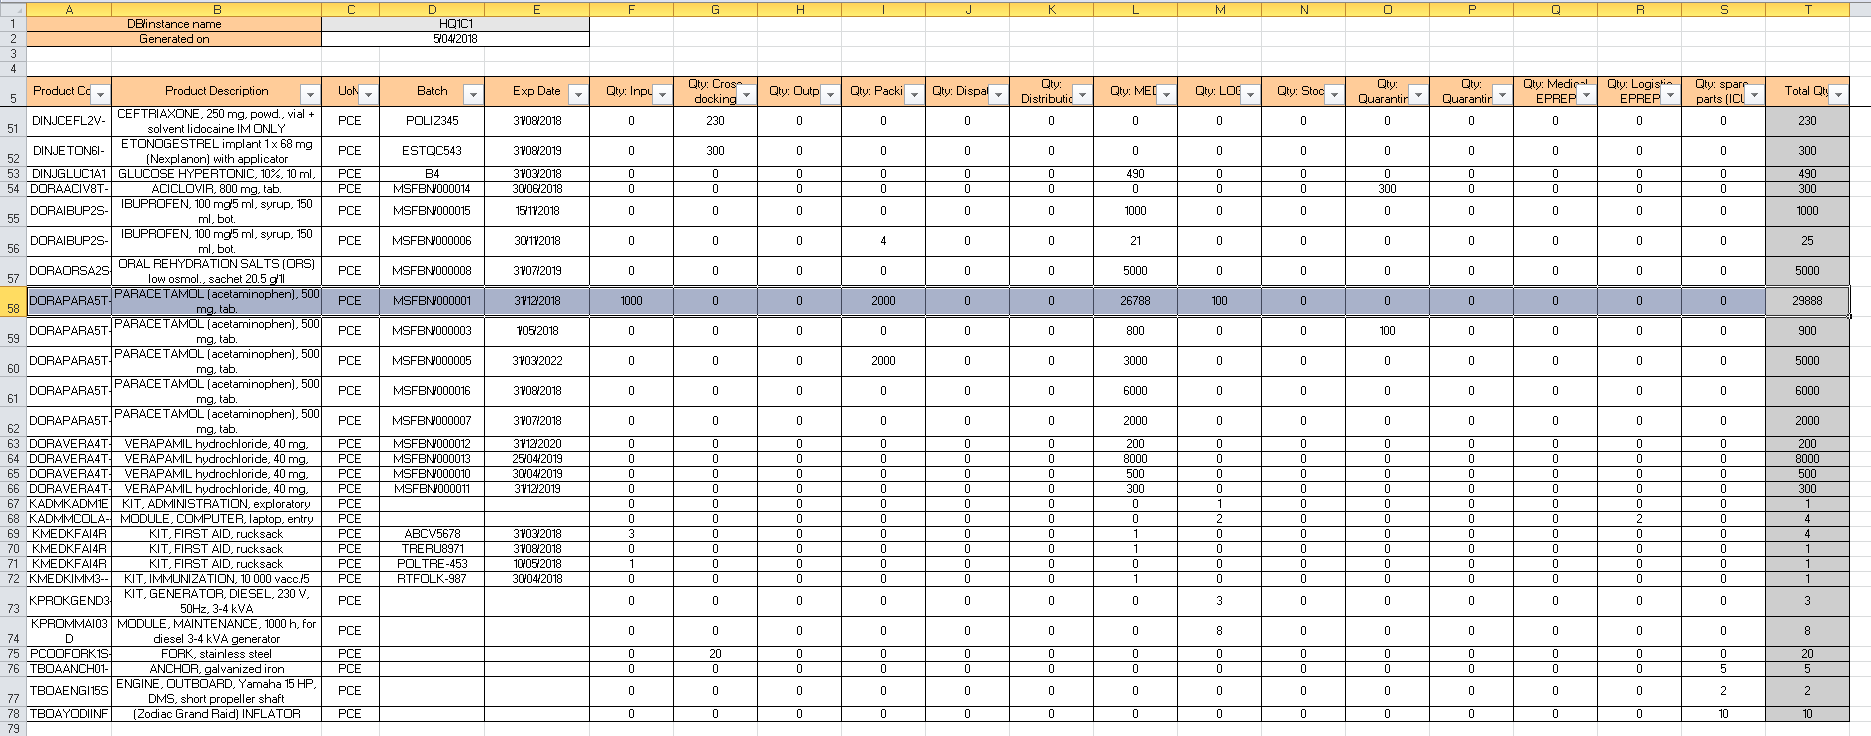
4. Once the report is generated you may open/download it from the action menu.
|
|
|
Export Inventory Level – Global View Report |
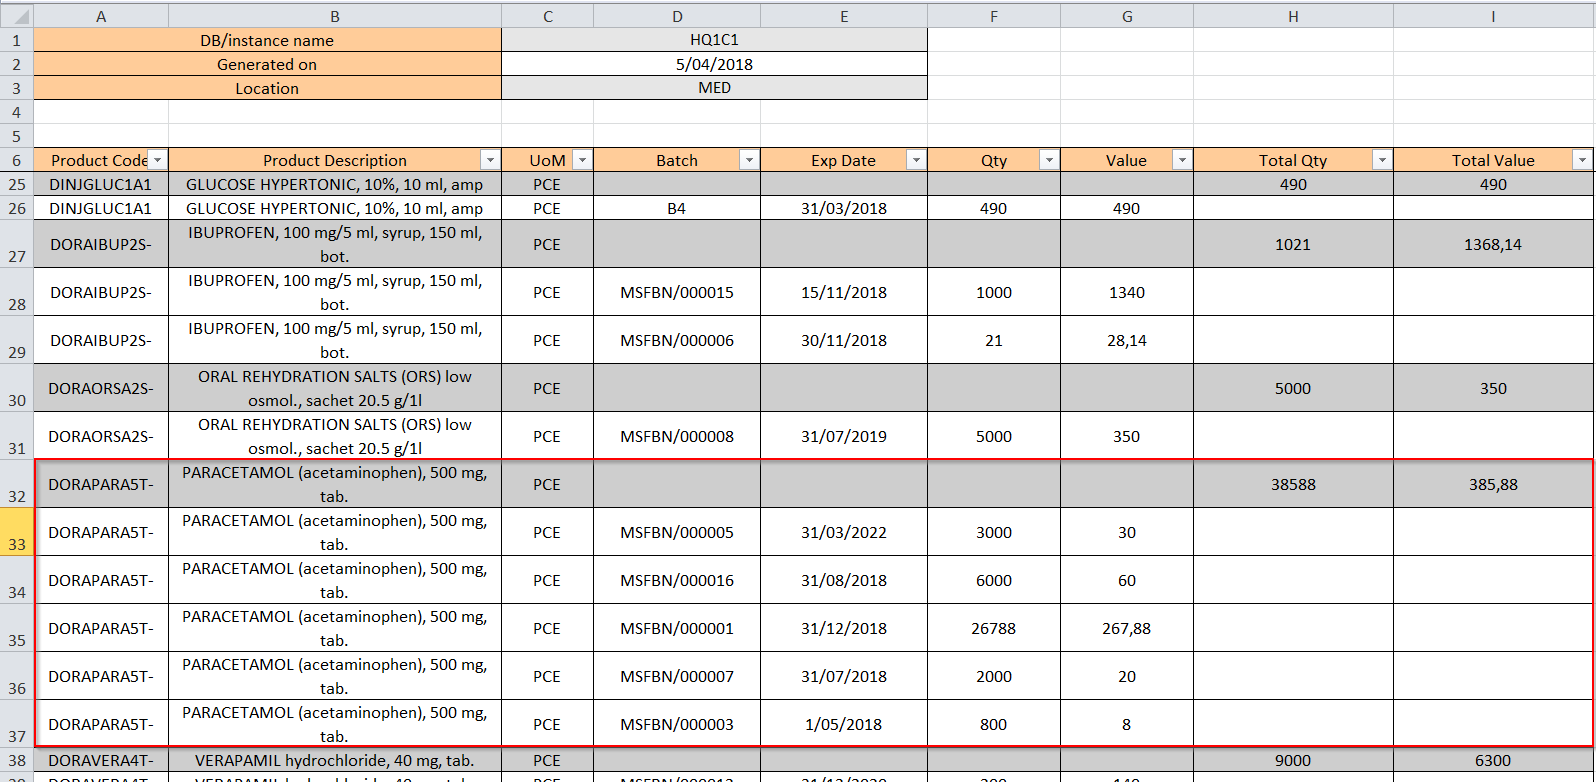
On top of the excel sheet, you can see the instance name and the date of the generation of the report.
The Global View report shows for each product/batch the real stock level in each internal location of the instance. The last column shows the total real stock level in all internal locations.
If a product is not batch managed, you only have one line for this product and the BN/ED columns are empty.
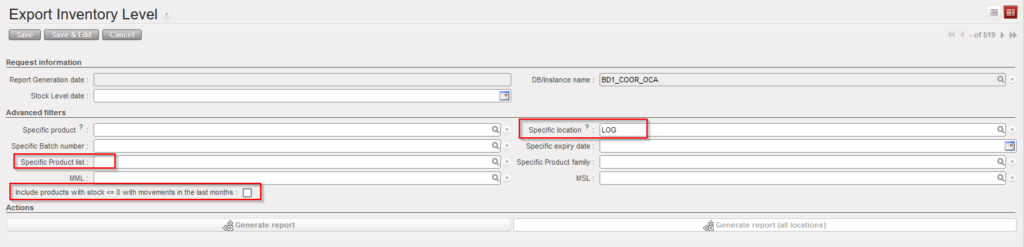
If you generated the Location View report, you will get a similar report but organized differently and focusing on one specific location.
|
|
|
Export Inventory Level – Location View Report |
|
|
|
Export Inventory Level – Location View Report |
On top of the excel sheet, you can see the instance name, the date of the generation of the report and the selected location.
The Location View report shows for each product/batch the real stock level in the selected location. The grey lines show the total real stock level per product in the selected location.
Please note that if the “Location” filter is chosen and at the same time the “Specific Product list” filter is chosen as well, only the products from the product list in that location will be displayed with quantities in that location (including product <=0 with movements in the last months)., the list will exclude the batches with 0 stocks and which have not moved in the defined value X months.
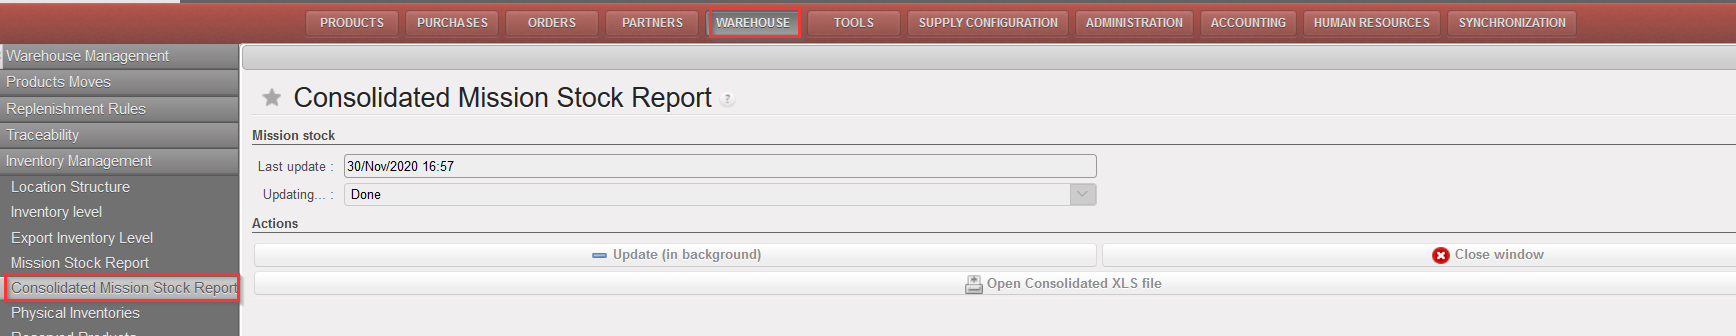
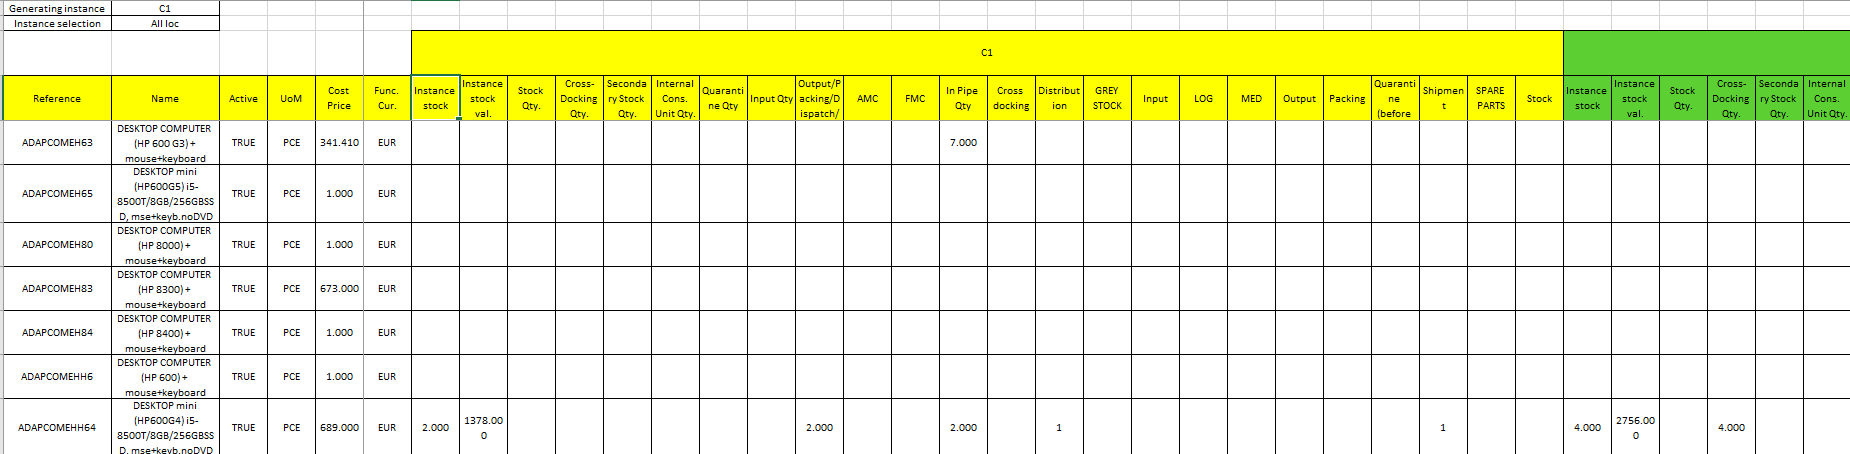
The consolidated MSR can only be generated from a coordination. This report derived from the MSR, is more detailed in the sense that with the display of the stock levels of all internal locations of the coordination as well as the stock levels of all internal locations of its children (project instances). The information is similar to the other report but is also given location per location.
Go to: Warehouse / Inventory Management / Consolidated Mission Stock Report
|
|
|
Consolidated Mission Stock Report |
|
|
|
Consolidated Mission Stock Report – Excel Export |