H. RESERVED PRODUCTS REPORT

Supply User Manual ENG -> 5. Warehouse -> 5.16 LU-SU4302: Stock Inventory Reports -> H. RESERVED PRODUCTS REPORT

H. RESERVED PRODUCTS REPORT

UniField allows you to check the stock levels for products which are allocated to different document: (OUT;Pick; INT; PPL and SHIP). Note that this report will not show the available stock.

Go to: Warehouse / Inventory Management / Reserved Products

  1. Click on the “Reserved Products” sub-menu.

Filter can be set on “Location” or on “Product”.

The report displays the Location, Product and Reference of the Document on which products are allocated.

Reserved Products

The report can also be Exported to an Excel file.

Link to generate reserved Stock Report in Excel

Reserved Stock Report in Excel

Please note that the “Partner” field is for FO while the “Origin” field is for requesting location of IRs.

G. UNRESERVED STOCK REPORT

Supply User Manual ENG -> 5. Warehouse -> 5.16 LU-SU4302: Stock Inventory Reports -> G. UNRESERVED STOCK REPORT

G. UNRESERVED STOCK REPORT

UniField allows you to check the stock levels in “Cross Docking” location for products that are not reserved; that is to say that these products have most certainly been Cancelled from a PICK or an OUT document (and sent to Cross Docking). This report is therefore supposed to help with the stock cleaning process.

Go to: Warehouse / Reporting / Unreserved Stock Report

  1. Click on the “Unreserved Stock Report” sub-menu.

Unreserved Stock Report

The report will display the products with their BN/ED, if any, and their Quantity.

F. STOCK BY LOCATION

Supply User Manual ENG -> 5. Warehouse -> 5.16 LU-SU4302: Stock Inventory Reports -> F. STOCK BY LOCATION

F. STOCK BY LOCATION

UniField allows you to check the stock levels in all locations for a given product.

Go to: Products / Products / Products

  1. Locate the required product.
  2. Click on the check box on the left side of the screen in front of the require product.
  3. Select the option “Stock by Location” in the action menu

Stock by Location

       4. In the “Stock by Location” screen which opens, click on the “Expand all” button.

Stock by Location

The real and virtual stock levels of the selected product in each internal location of the instance are displayed.

Note that locations belonging to the “Instance Full View” are displayed. You may change and select the view “Partner Locations” or “Virtual Locations” if needed.

E. VIRTUAL STOCK LEVELS

Supply User Manual ENG -> 5. Warehouse -> 5.16 LU-SU4302: Stock Inventory Reports -> E. VIRTUAL STOCK LEVELS

E. VIRTUAL STOCK LEVELS

In UniField, you will often hear about the notions of real stock, virtual stock and available stock.

Understanding these concepts will help you to understand how the system is actually working.

The real stock is the actual stock level currently present in a location (or in several locations).

The virtual stock may be better understood if you think about a future stock.

A formula may help to understand: virtual stock = real stock + pipe line – reservation.

  • Products which are in the pipeline are increasing the virtual stock level (this includes for example Validated/ Confirmed PO lines or “Available” Incoming Shipment which will impact the virtual stock of the “Input” or “Cross docking” location). See also section on SYS-INTs in LU-SU4201.
  • Products which have already been reserved or are due to leave a location reduce the virtual stock level (PICK, INT, OUT -according to their state- will impact the virtual stock level).

Note that as a movement always has a source and a destination location, all these documents will always impact 2 virtual stock levels in 2 different locations. The impact will be negative for the source location and positive for the destination location.

The virtual stock level gives a “snapshot” of how the stock is likely to evolve in the future, based on the transactions already registered in the system.

Virtual and real stock levels can be seen in the Stock by Location screen (as explained in the next section):

Stock by Location

D. INVENTORY LEVEL

Supply User Manual ENG -> 5. Warehouse -> 5.16 LU-SU4302: Stock Inventory Reports -> D. INVENTORY LEVEL

D. INVENTORY LEVEL

This functionality offers similar information than the “Export Inventory Level” functionality but provides an on-screen report. Filters and “Group by” options allow to decide more precisely which data should be selected and how results should be showed.

Go to: Warehouse / Inventory Management / Inventory level

Inventory Level

You may use the filters and the “Group by” options to refine the data selection and design the report as you wish. In the action menu, the “Export” option allows exporting result to Excel.

Inventory Level

C. EXPORT INVENTORY LEVEL

Supply User Manual ENG -> 5. Warehouse -> 5.16 LU-SU4302: Stock Inventory Reports -> C. EXPORT INVENTORY LEVEL

C. EXPORT INVENTORY LEVEL

The “Export Inventory Level” functionality allows you to export to Excel the stock levels of an instance either by filtering on specific criteria such as product, batch, location or having a full view of your instance stock with all the locations displayed.

Depending on your choice, you will have two types of reports: the “Stock Inventory Global View” report or the “Stock Inventory Location View” report.

The Stock Inventory Global View displays the real stock level of each product/batch in each internal location and the total real stock level in all these locations.

The Stock Inventory Location View displays the real stock level of each product/batch in the selected location and the real stock level of each product (total of all batches) in the selected location.

One significant improvement that has been added to this export is that it can be generated in the past which allow user to have the stock level at a specific date.

Also it is now possible to filter the results in order to have as well the products <= 0 which had movements in the last X months.

Go to: Warehouse / Inventory Management / Export Inventory Level

  1. Click on the “New” button.
  2. Complete the parameters. If you don’t specify a location, you can only get the global view report. If you specify a location you can only get the location view report.
  3. Click on the “Generate report (all locations)” button to get the global view report.

This image has an empty alt attribute; its file name is export-inventory-level-1-1024x239.png

Export Inventory Level – Global View Report

       4. Once the report is generated you may open/download it from the action menu.

Export Inventory Level – Global View Report

On top of the excel sheet, you can see the instance name and the date of the generation of the report.

The Global View report shows for each product/batch the real stock level in each internal location of the instance. The last column shows the total real stock level in all internal locations.

If a product is not batch managed, you only have one line for this product and the BN/ED columns are empty.

If you generated the Location View report, you will get a similar report but organized differently and focusing on one specific location.

This image has an empty alt attribute; its file name is Export-Inventory-Level2-1024x247.png

Export Inventory Level – Location View Report

Export Inventory Level – Location View Report

On top of the excel sheet, you can see the instance name, the date of the generation of the report and the selected location.

The Location View report shows for each product/batch the real stock level in the selected location. The grey lines show the total real stock level per product in the selected location.

Please note that if the “Location” filter is chosen and at the same time the “Specific Product list” filter is chosen as well, only the products from the product list in that location will be displayed with quantities in that location (including product <=0 with movements in the last months)., the list will exclude the batches with 0 stocks and which have not moved in the defined value X months.

B. b) Consolidation Mission Stock report

B. b) Consolidation Mission Stock report

The consolidated MSR can only be generated from a coordination. This report derived from the MSR, is more detailed in the sense that with the display of the stock levels of all internal locations of the coordination as well as the stock levels of all internal locations of its children (project instances). The information is similar to the other report but is also given location per location.

Go to: Warehouse / Inventory Management / Consolidated Mission Stock Report

Consolidated Mission Stock Report

Consolidated Mission Stock Report – Excel Export

B. a) Mission Stock report

B. a) Mission Stock report

The MSR is a powerful report to look at stock levels, value of these stocks, consumption rates and pipes.

If the report is launched on a project instance it allows you to analyze these data on this instance.

If the report is launched on a coordination or on the HQ instance it allows you to analyze these data on this instance but also on one of the “children” instances (i.e. a project instance if launched on a coordination or a coordination/project instance if launched on the HQ) or globally (i.e. tantalizing the data) if you select the “full view” option.

It may be useful for a coordination to know all stock levels within the mission (i.e. stock levels in capital stock levels on projects or total stock levels).

A similar analysis can also be interesting to get at HQ level as it may be useful to know stock levels on all instances globally (all coordination and projects). This can facilitate inter-missions supply, help in case of emergency or allow analyses on global OC stocks.

Note that from a coordination instance you can see stock levels on all projects linked to this coordination (children), but the opposite is not true. You cannot see from a project stock levels in capital or on other projects (parent or brothers). However, the MSR can also be very useful to use at project level in order to analyze stock levels on this specific (project) instance.

In the below example, we focus on the use of the MSR at coordination level (not HQ, not project).

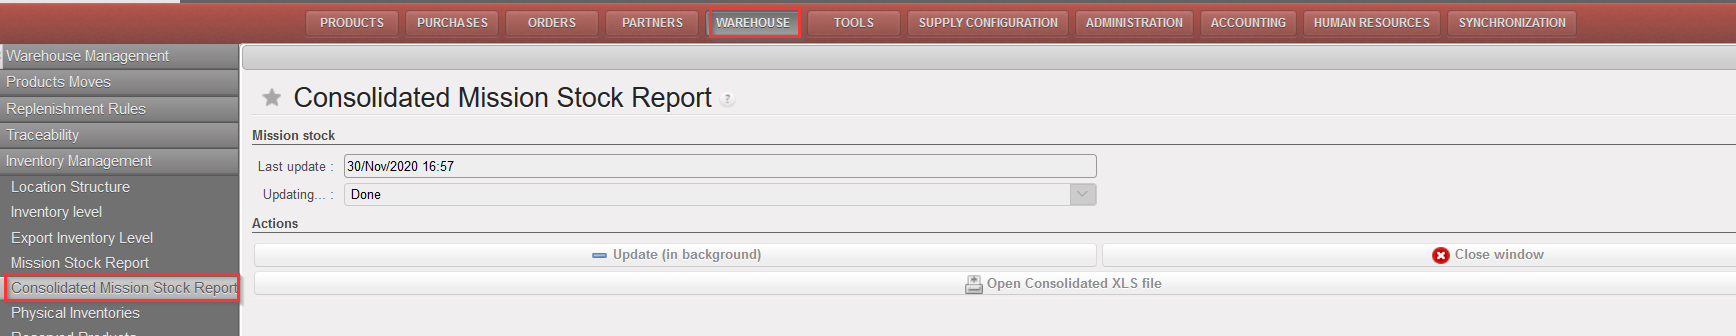
Go to: Warehouse / Inventory Management / Mission Stock Report

Mission Stock Report

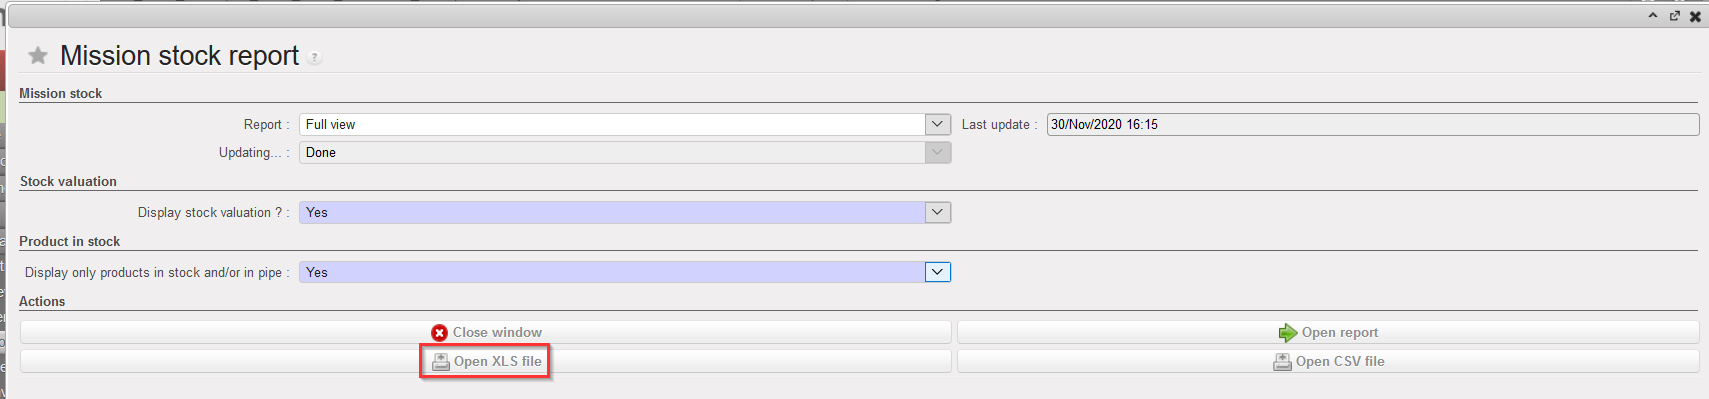
The initial screen informs you on when data were last updated (see the field “Last update“). Mission Stock Report data are updated thanks to the synchronization mechanism and to some programs which are running in the background.

If you want to refresh the data, select the instance on which you are running the MSR (coordination in this example) in the “Report” field and click on the “Update (in background)” button.

Be aware that this update can take some time, reason why this update is most of the time running automatically in the background at specific times. If you want to do a complete refresh, make sure that the same operation is firstly done on all project instances linked to your coordination (children) and that all instances are synchronized after these updates.

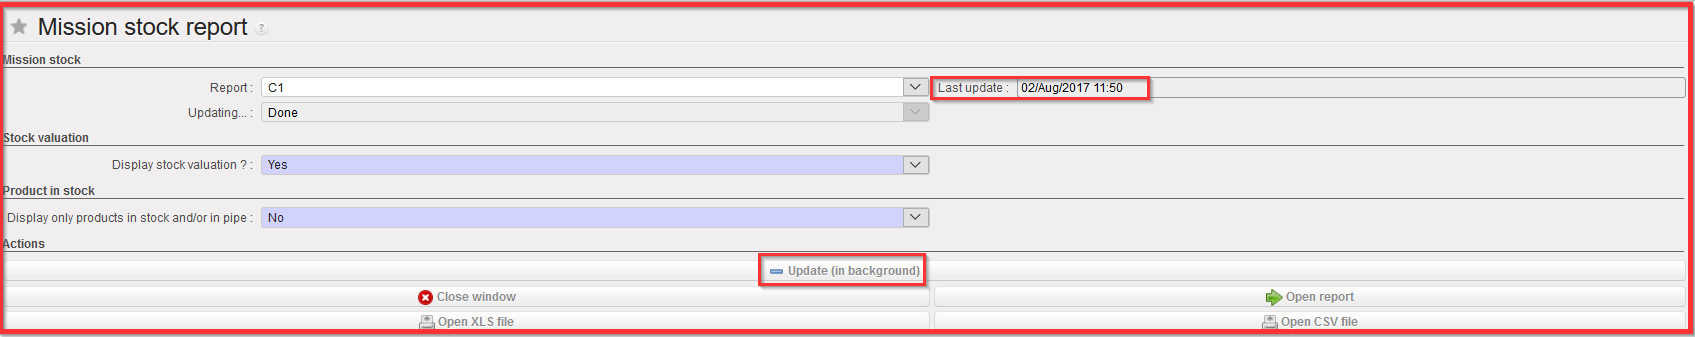
Via the above screen, you may choose what you want to see on the report:

  1. In the “Report” field, select which stock levels you want to see (choose the coordination if you want to see the stock levels in capital, a project if you want to see the stock levels on a specific project or “Full view” if you want to see the total stock levels on the whole mission).
  2. In the “Display stock valuation” field, select “Yes” if you want to see, on top of the stock levels, the valorization of these stocks. As unit price, the cost price of the relevant PMD sheets on the instance where the MSR is launched will always be used to value the stocks (even if from a coordination, you analyze the stocks of a project).
  3. In the “Display only products in stock and/or in pipe” field, select “Yes” if you only want to see on the report products with stock levels > 0 and/or products with pipe > 0 (otherwise, all products existing on the instance will appear on the report).

Finally, you should click on one of the following buttons:

  1. “Open report” will produce an on-screen report.
  2. “Open XLS file” will generate the same report on an Excel file
  3. “Open CSV file” will generate the same report on a CSV file.

If we launch the report on coordination with the following parameters and ask to get the XLS file, we get the below result.

Mission Stock Report

Mission Stock Report – Excel file

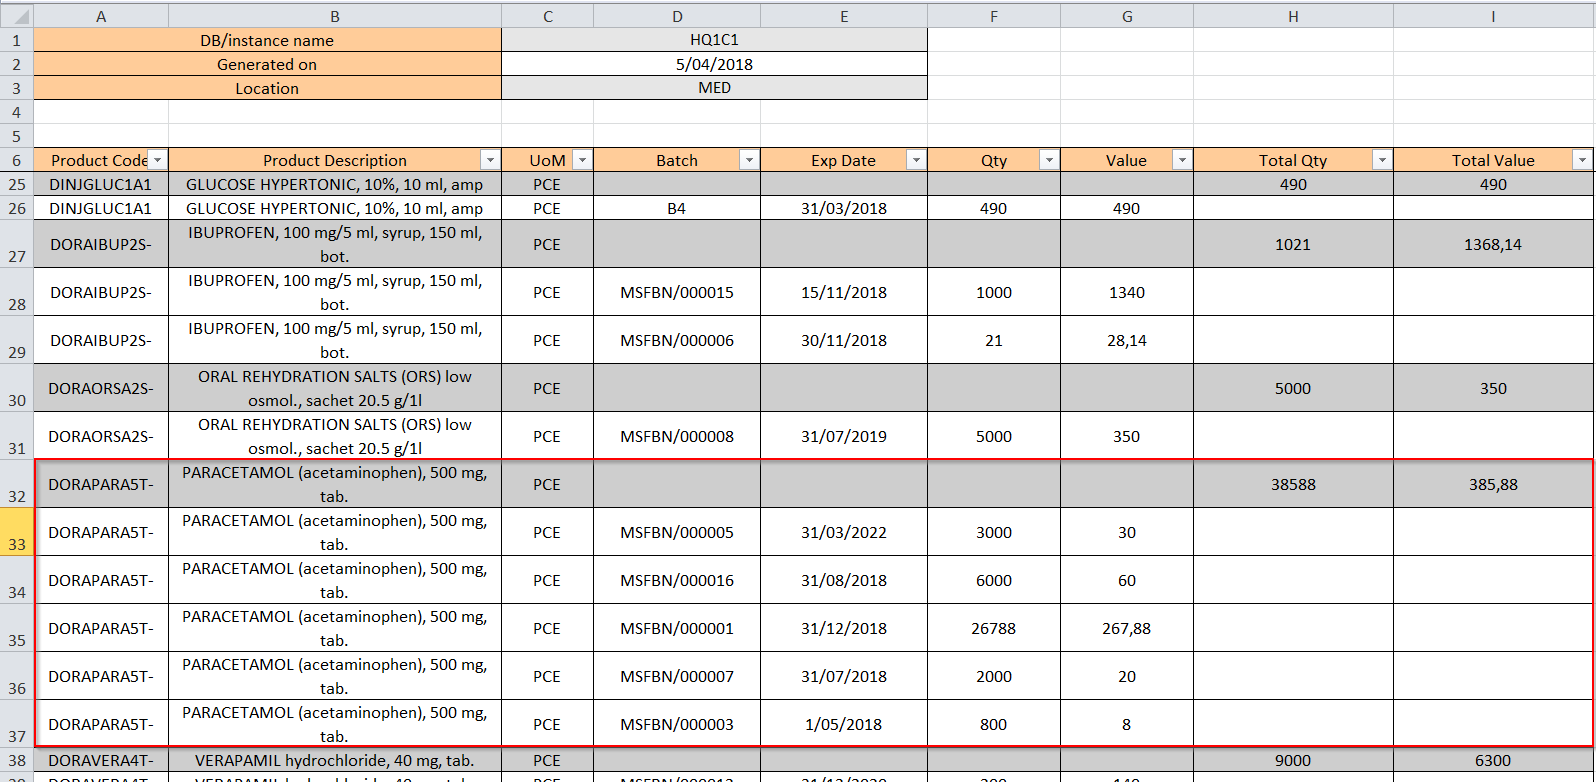
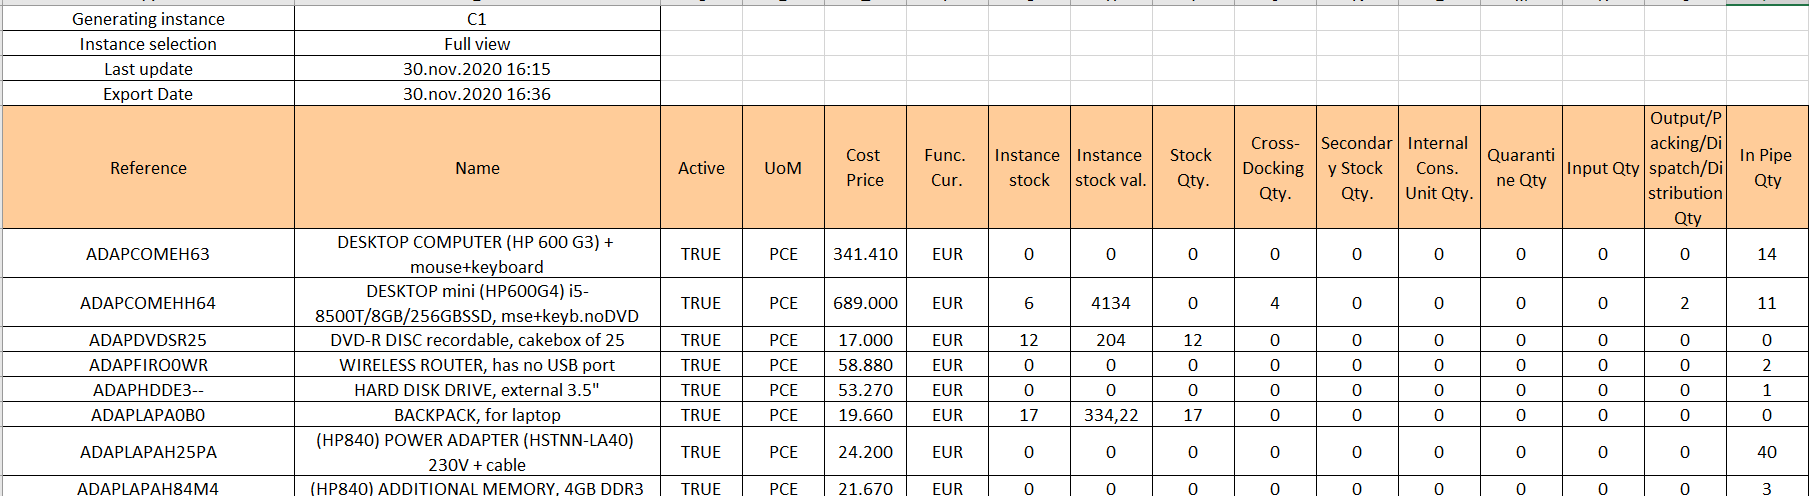
A report is produced in Excel according to the parameters entered. Use filters and “freeze panes” in Excel to be able to use the report in the best way. On top of the Excel sheet, you see the “Generating Instance” and what was selected in the parameter “Report“. The “Last update” cell will indicate the last time the update was launched for the report while the “Export Date” will indicate the date of the current export.

The following information is available in the report:

  • Product code (Reference)
  • Product description (Name)
  • Unit of measure (UoM)
  • Active (True or False)
  • Cost price (in functional currency, taken from the PMD sheet on the instance where the MSR was launched)
  • Functional currency
  • Instance stock (total real stock level on the instances internal locations)
  • Instance stock val. (value of the instance stock, cost price used)
  • Stock Qty.(total real stock level on the instances internal locations excluding cross docking, intermediate stocks and ICUs)
  • Cross-Docking Qty (total real stock level in cross docking on the instances)
  • Secondary Stock Qty. (total real stock level in intermediate stocks on the instances)
  • Internal Cons. Unit Qty. (total real stock level in ICUs on the instances)
  • Quarantine Quantity (total stock level in Quarantine (analyse+before scrap))
  • Input Quantity (total stock level in the Input location)
  • Output/ Packing/ Dispatch/ Distribution quantity (total stock level in these 4 locations)
  • In Pipe Qty (total quantity currently being ordered, Validated/ Confirmed PO-line and IN “Available”)

Instance stock = Stock Qty. + Cross-Docking Qty.+ Secondary Stock Qty.+ Internal Cons. Unit Qty.+ Quarantine Qty.+ In input + Output/Packing/Dispatch/Distribution qty.

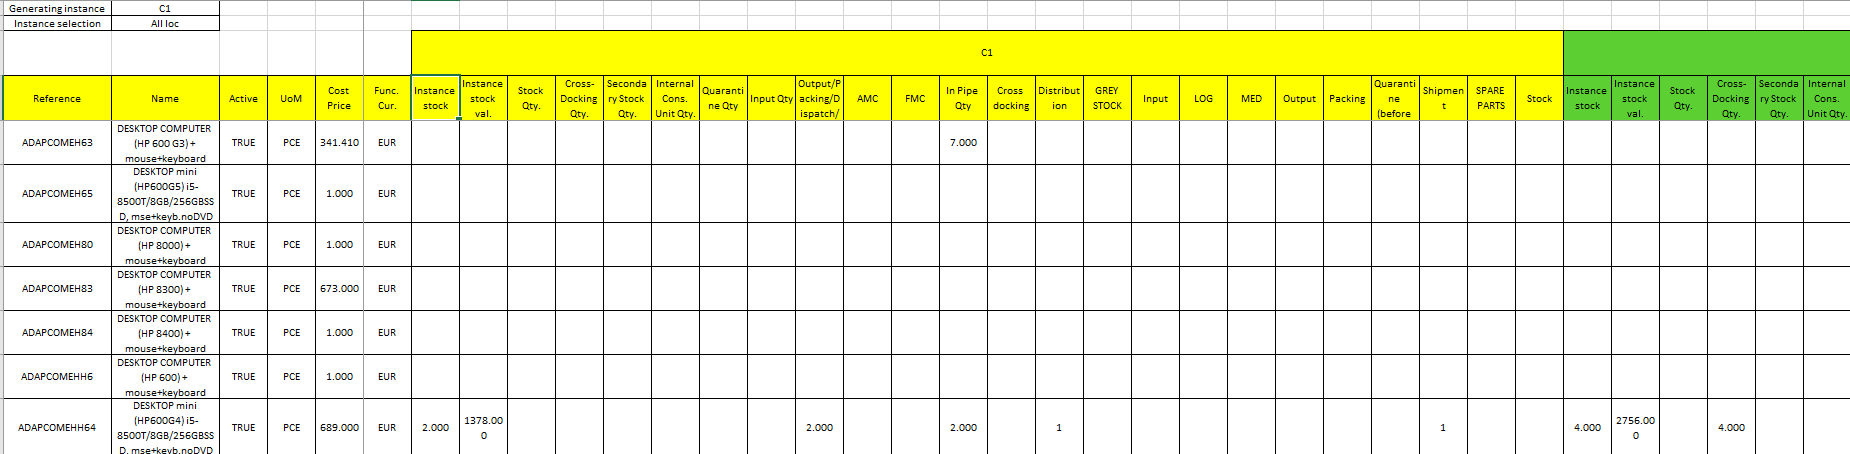
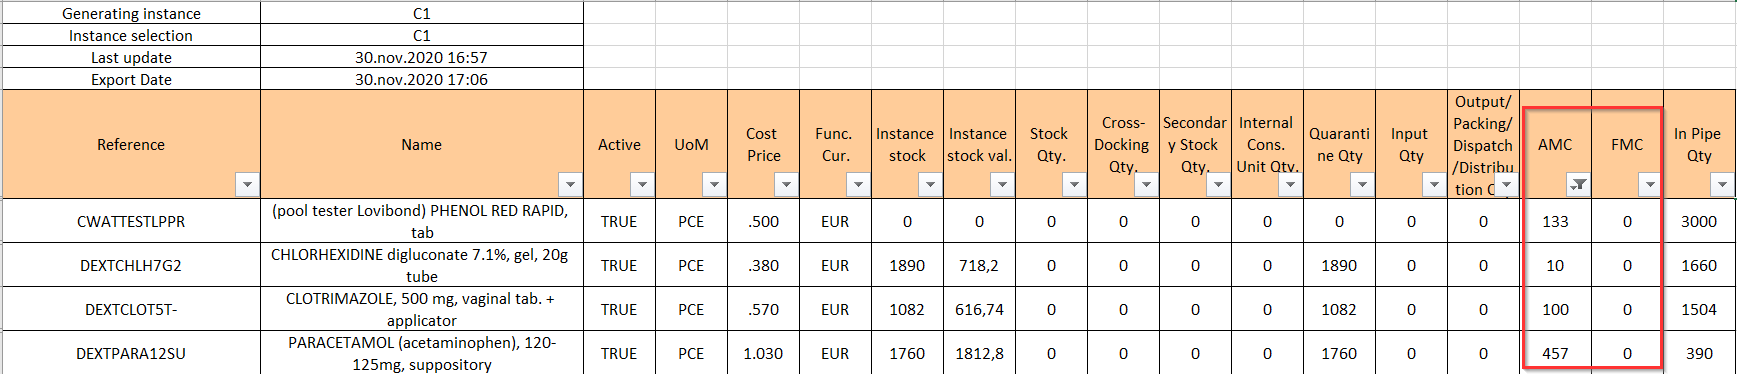
If you launch the MSR on a single instance (being your instance or one of your children instance), you will see 2 additional columns: AMC and FMC. Obviously, these consumption rates are meaningless if the report is launched in full view as they will most probably be different on the different instances.

  • The AMC is the same as the one appearing on the PMD sheet. This AMC is calculated over the 3 past completed months. This means that if the report is launched on the 11/04/2018, the AMC is calculated based on the consumptions recorded between the 01/01/2018 and the 31/03/2018.
  • The FMC (if any) is copied from a Monthly Consumption Report

Mission Stock Report – Consolidated XLS file

Note that the “In Pipe Qty” could be misleading if you look at it on a MSR launched in full view as a PO created on a project and addressed to coordination could trigger the creation of a PO on the coordination (following the sourcing of an FO on order) which will be addressed externally. If these 2 POs are validated/confirmed, the quantity will be counted twice (doubled) in the pipe.

A. HOW TO VIEW LAST PRODUCT INVENTORIES.

Supply User Manual ENG -> 5. Warehouse -> 5.16 LU-SU4302: Stock Inventory Reports -> A. HOW TO VIEW LAST PRODUCT INVENTORIES. 

A. How to View Last Product Inventories.

This functionality allows seeing when the last Physical Inventory (count) was done for a specific product.

According to most OC procedures (check with your own OC) physical inventories should be carried out on at least a yearly basis, and in many cases, more regularly, in order to ensure stock records are accurate. UniField offers the possibility to view the last time a product was counted and recorded in a physical inventory. This can be useful to see which products have not been counted since long.

Go to: Warehouse / Inventory Management / Last Product Inventories