D. HOW TO RE-VALUATE THE COST PRICE/AVERAGE PRICE OF PRODUCTS
It may happen that products cost of an instance (cost price in the PMD sheets) are not any more accurate. This can be explained by various reasons such as misuse of the system, inflation, variability in prices,… The direct consequences of wrong products cost prices are that stocks will not be correctly valued and that orders won’t propose correct prices.
Fortunately, the “Product cost revaluation” functionality allows revising cost prices of products. This functionality should be used with great care, in accordance with your OC procedures and involve finance.
Go to: Warehouse / Inventory Management / Product cost revaluation
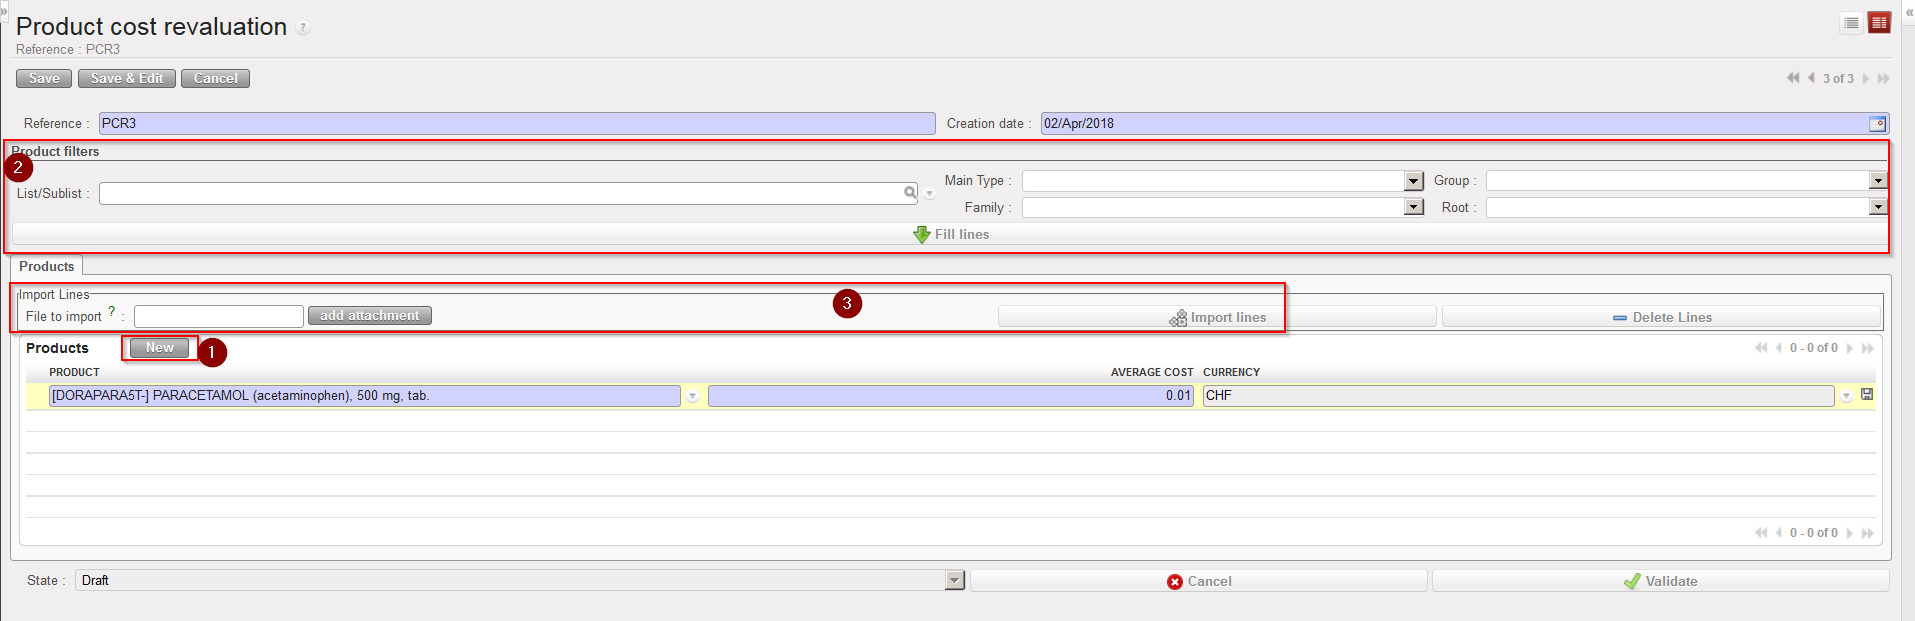
1.Click on the “New” button.
2. Enter an appropriate “Reference“.
3. The “Creation date” defaults to today’s date but can be changed if needed.
Product Cost Revaluation
4. Enter the products which you are reevaluating either by:
Adding products manually using the “New” button.
Using the Product filters area (“List/Sublist” or “Nomenclature”) then clicking on the “Fill lines” button.
Importing a file (by clicking on the “add attachment” button, browsing and selecting the file, then clicking “Import lines”).
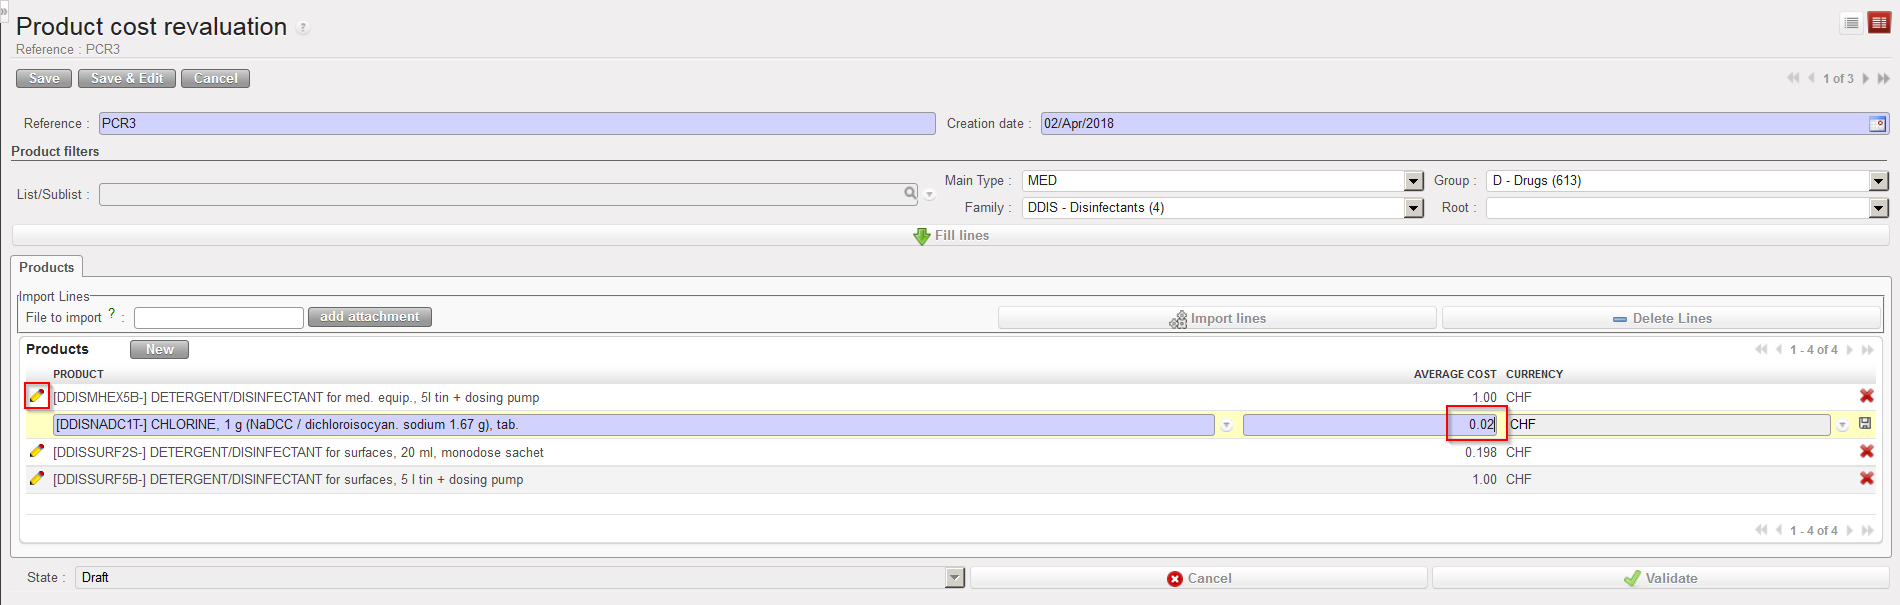
5. The system displays on each line, the product, the current cost price on the instance (in the functional currency) and the functional currency. To edit each line, click on the pencil icon.
6. For each line, update the cost price (average cost) as needed and save the change by clicking on the floppy disk at the end of the line. Note that if you used an import file this step has probably already been done as new prices have probably been included in the imported Excel file.
Product Cost Revaluation – Updating a cost price
7. When each line has been updated and saved, click on the “Validate” button.
8. Finally, click on the “Confirm” button. The status of the document switches to “Done“. No more changes can be done on the document. The cost price of the products has been updated on the PMD sheet.
The Product Cost Revaluation functionality offers and export option in the action menu (“Cost Reevaluation Excel Export”). Use it to generate a template that can be used to prepare an excel file for import.
Note that if you select the option “Track Changes – Product prices“, available in the action menu of the PMD sheet, you will be able to see the evolution of the cost price of a product, including the changes due to product cost revaluations.
An important review of this functionality has been introduced in January 2018 (with the release UF7.0).
Physical Inventories which were done before this date can still be viewed through Warehouse / Inventory Management / Previous Physical Inventories, but this menu should not be used to create new inventories. According to you user rights you will have/not have access to this menu.
All Physical Inventories should be done through the menu Warehouse / Inventory Management / Physical Inventories.
Physical inventories (stock counts) done in the warehouse need to be recorded in the system to ensure the adequacy between physical stock levels and system stock levels.
The Physical Inventory functionality is a step by step transaction which provides all necessary features to properly support such a count.
This section explains first briefly how to do a basic Physical Inventory. At the end of the section some advanced features related to the functionality are explained. Be aware that all features available on PI are not explained in this manual.
Go to:Warehouse / Inventory Management / Physical Inventories
Click on the “New” button to create a new inventory. At this stage of the process, the PI has only one tab named “Products“.
Enter Inventory “Details“.
Select the “Location” in which you are counting the items.
Enter the name of the “Responsible” for this inventory.
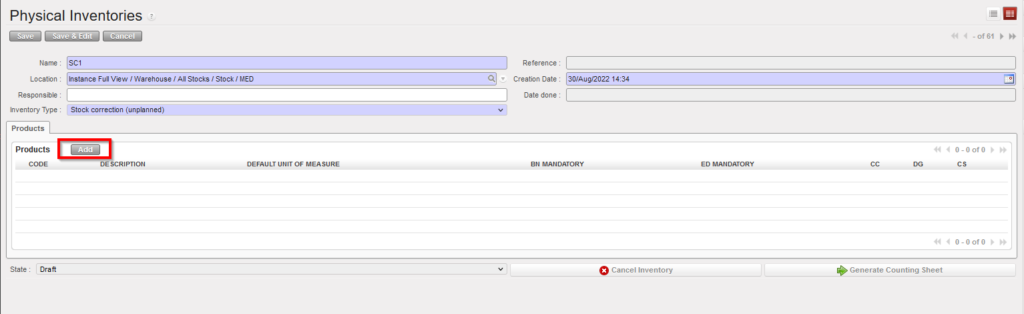
To add product lines you may
a) Use the “Add” button and select products in the “Search Products” screen.
b) Use the “Products Selection” button to include products in the PI according to various criteria.
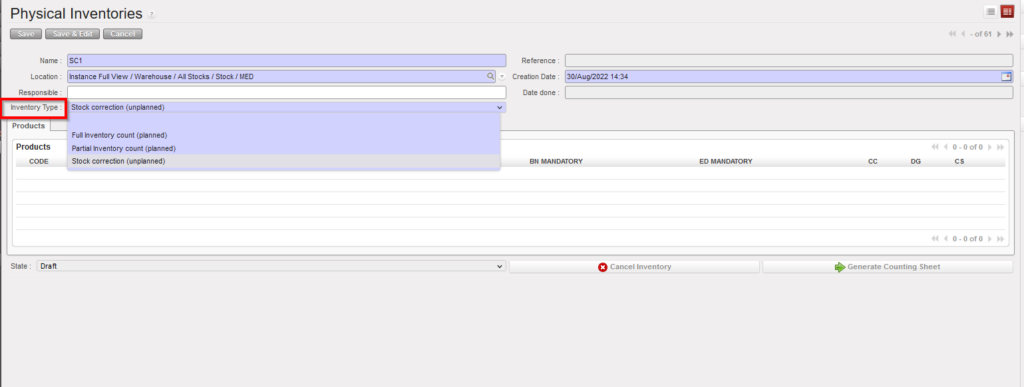
c) Use the mandatory drop-down list “Inventory Type” with below options:
Full inventory count (planned),
Partial inventory count (planned)
Stock correction (unplanned).
Including products on a Physical Inventory
If 3rd option is selected “Stock correction (unplanned)”, only the “Add” button displays to allow products to be added. The button “Products selection” is not displayed.
Drop-down list values of (Inventory Type) options can be changed as long as no products have been added yet.
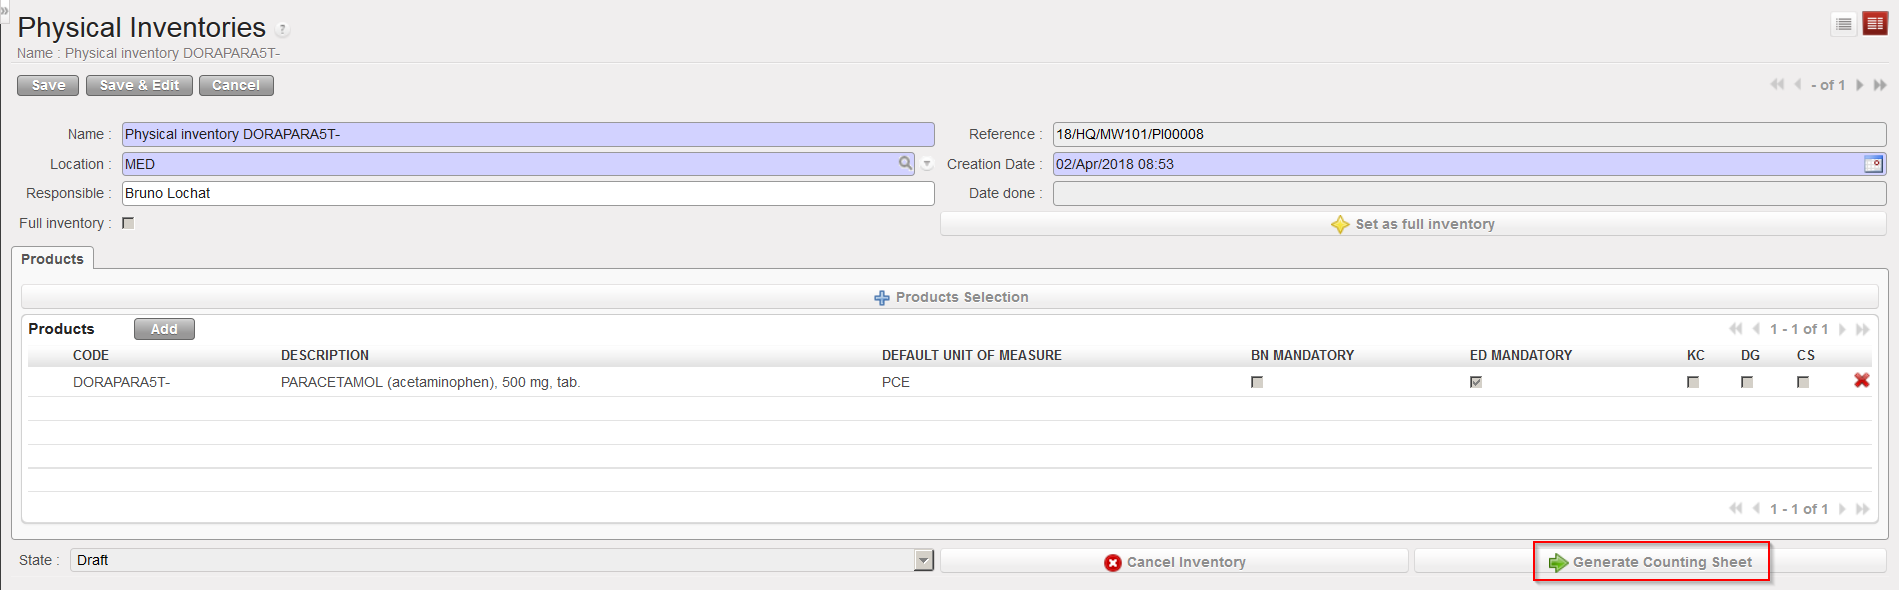
6. Once all needed product codes have been included on the PI, click on the “Generate Counting Sheet” button.
Generating Counting Sheet
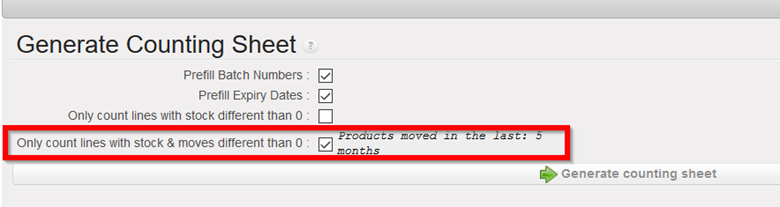
7. On the “Generate Counting Sheet” screen, you may decide if you want to include (print) in the counting sheet
BN
ED
Only items which have a stock level <> 0
Only count lines with stock & moves different than <> 0
In case of blind inventory – the B/N option is completely blind; it is not prefilled. There is just a product. On that case Unifield enables a standard number of 3 lines which are displayed per BN/ED product. This means whether there is “1” BN/ED for a product or “10”, there will always be 3 lines per BN/ED product shown (on screen and export). The user can see three lines if the box is not ticked prefilled B/N(batch no.) or ED(expiry dates).
Its possible to specify system should add products with movements in the last X months. and the same number of months specified to add products can be used to filter and display also the batches of the added products based on this timed selection. Where user has added products specifying products with movements in the last 5 months, this would be the default option ticked in the 4th checkbox on the “Generate Counting sheet” pop-up and only batches which have been moved in the last 5 months will be displayed in the counting sheet.
If the 4th checkbox is unticked, the original product selection remains unchanged, so all products with movements in the last 5 months will be displayed, but all of their batches will be displayed even those which were last moved several years before.
If the 3rd checkbox “only count lines with stock different than 0” is ticked, the 4th checkbox cannot be ticked. All previous displays of the Counting Sheet are still possible.
In the case of multiple additions of products were performed, the system will propose the greatest number of months used during the additions.
Tick/untick the check boxes according to your needs and click on the “Generate counting sheet” button.
Generating Counting Sheet
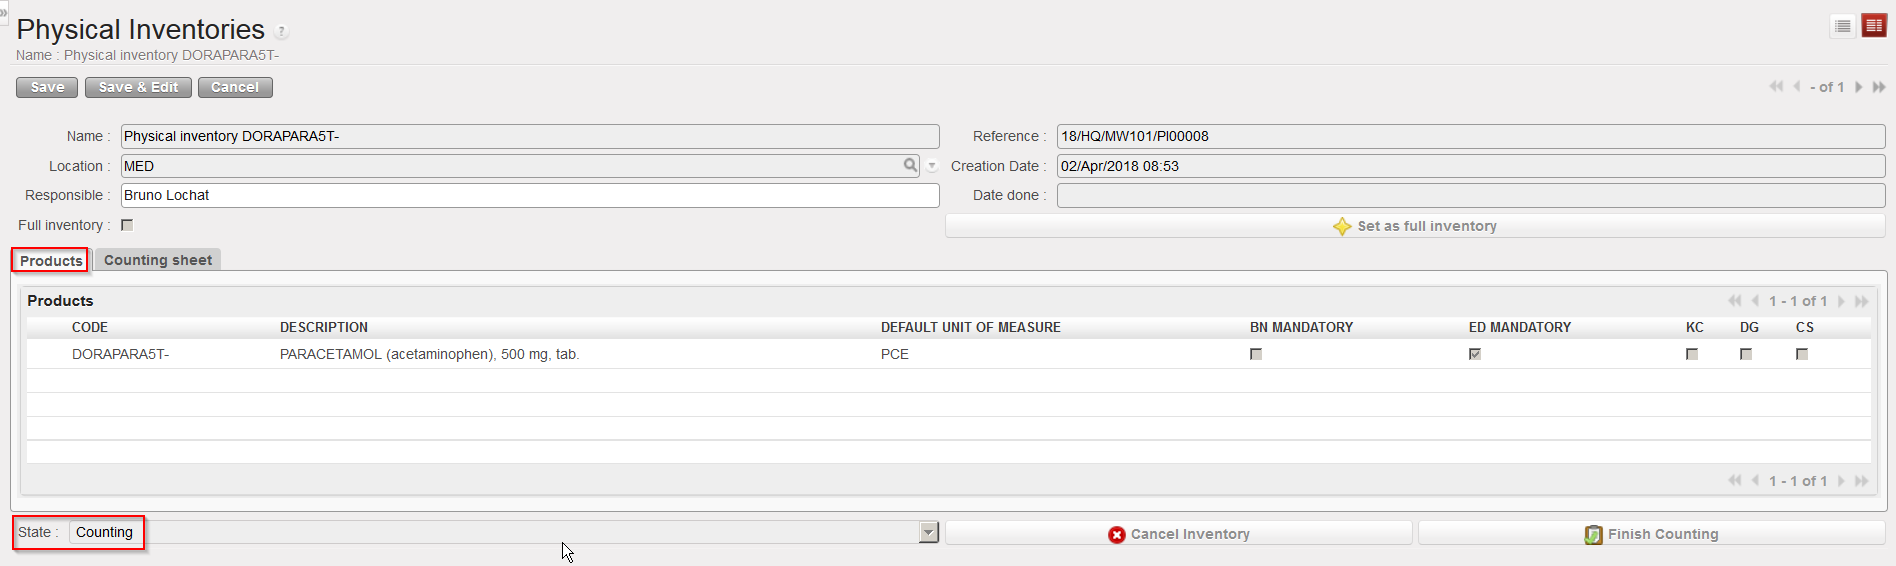
8. The PI switches to the state “Counting“. This means that the counting is currently ongoing in the warehouse. The tab “Products” (which was already present before) shows the products which have been selected. A second tab named “Counting sheet” has now appeared. According to the selection done at the previous step, this tab shows which products/batches should now be counted in the location.
Physical Inventory in state “Counting” – “Products” tab
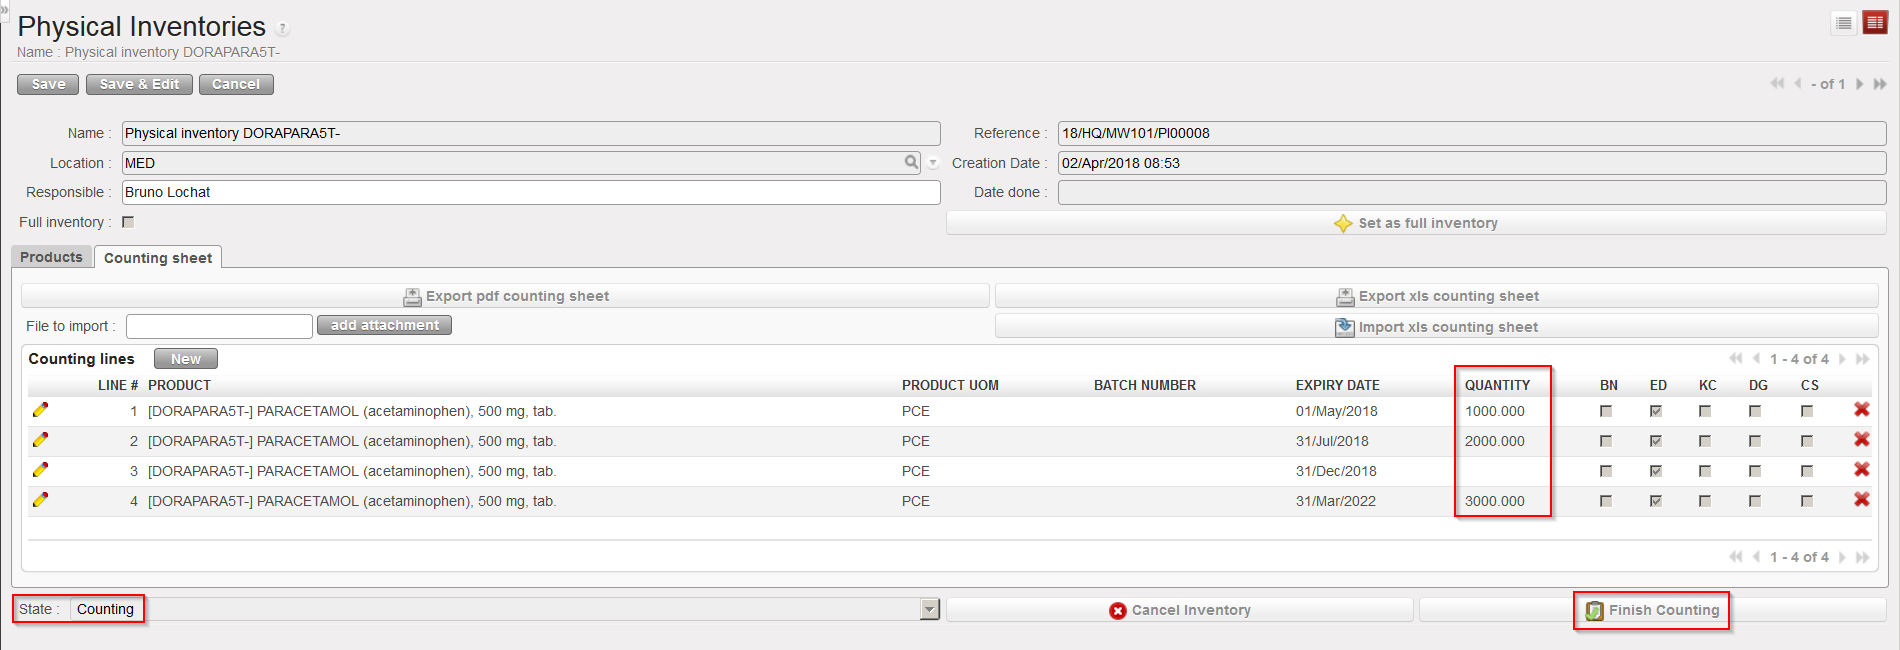
Physical Inventory in state “Counting” –”Counting sheet” tab
9. On the “Counting Sheet” tab, the buttons “Export pdf counting sheet” and “Export xls counting sheet” allow to export the counting sheet in PDF or excel, with the objective to facilitate the counting process in the warehouse.
10. Products/batches counted may be included on the PI in two ways:
A) Manually, using the pencil icon in front of each line to edit it and /or the “New” button located on top of the “Counting lines” table
B) Via file import, using the “add attachment” and “Import xls counting sheet” buttons in order to upload the filled counting sheet (with the count) that was exported in excel at the previous step.
At import of Counting Sheet, System will check Product / BN / ED, duplicate lines, and match imported Prod/BN/ED, add new lines, etc.
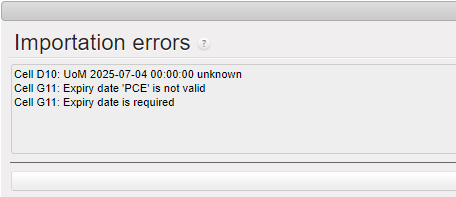
When Counting sheet contains value not recognized for UoM, or for ED import is blocked and a clearer warning message is displayed.
11. The state of the PI is still on “Counting” but you may now see on the “Counting sheet” tab for each counted product/batch, the quantity which has been counted in the warehouse. Click on “FinishCounting“.
Physical Inventory in state “Counting” – Counting sheet uploaded
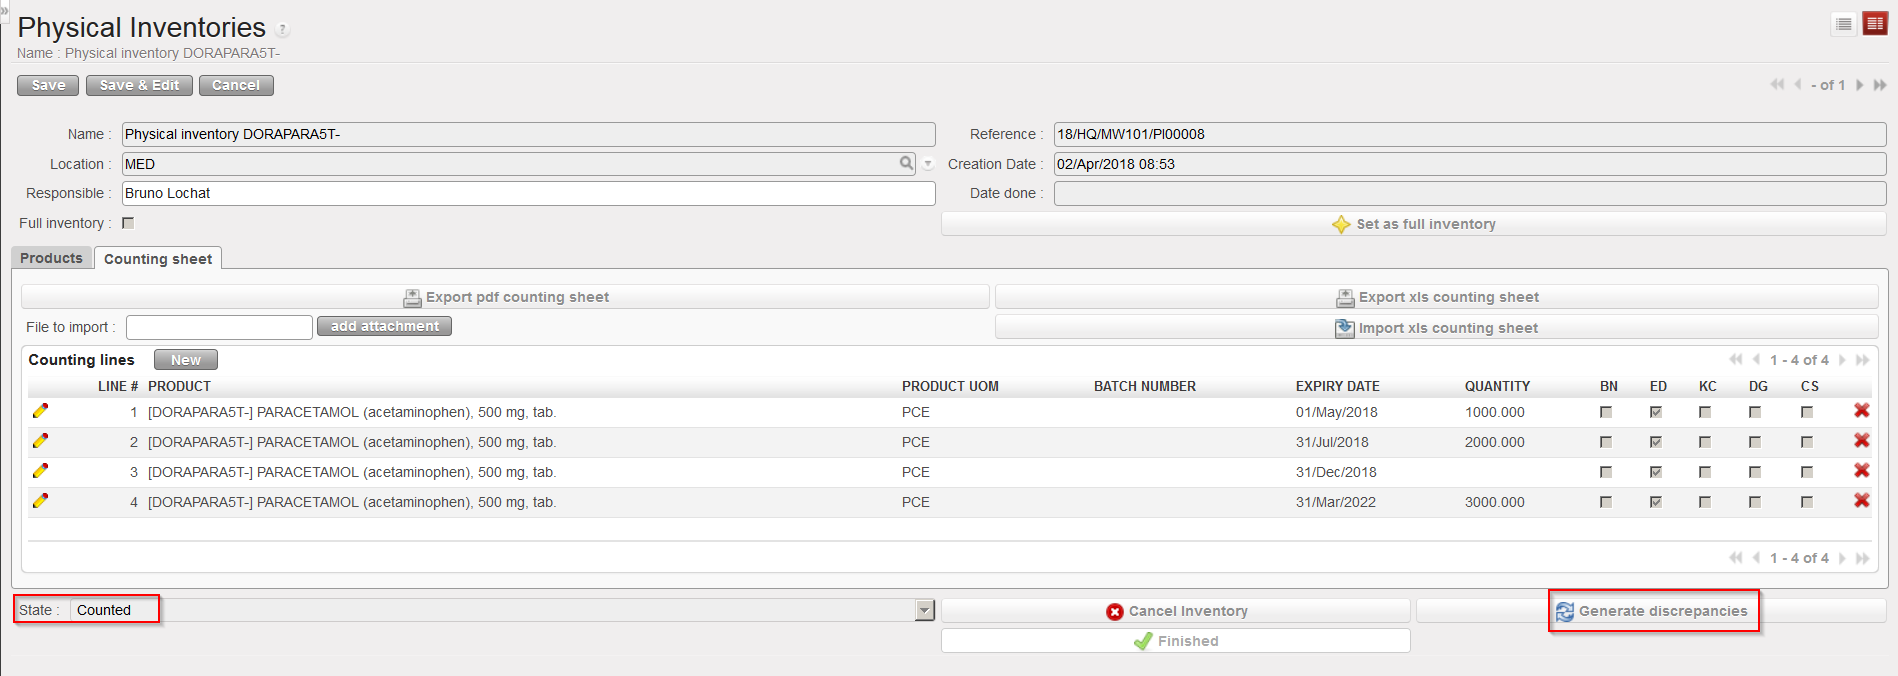
12. The PI switches to the sate “Counted“. Click on “Generate discrepancies“.
Physical Inventory in state “Counted” – Generating discrepancies
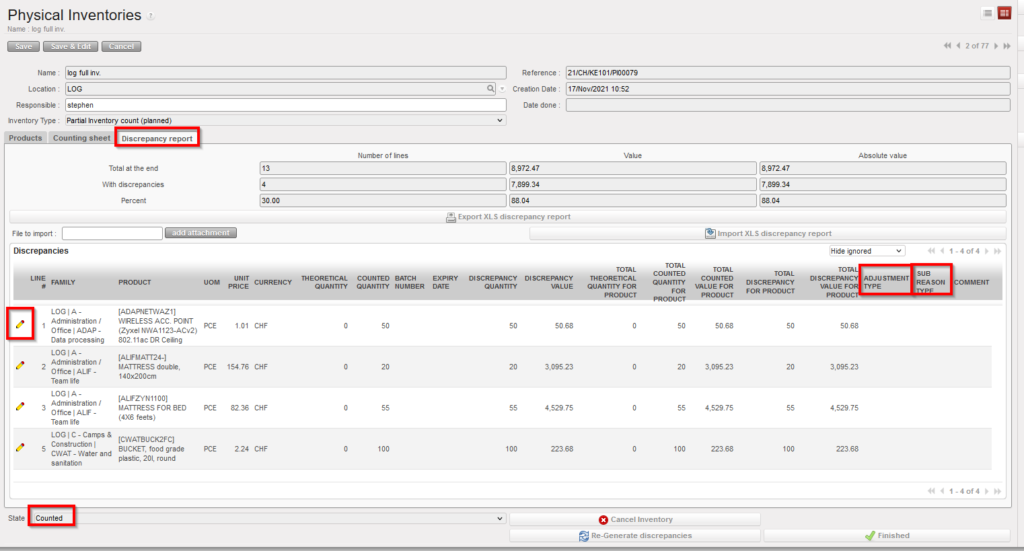
13. A discrepancy report is generated and is available on the “Discrepancy report” tab. This report shows discrepancies between the theoretical (system) quantities and the counted (physical) quantities. Each line of the discrepancy report must be edited in order to input the “ADJUSTMENT TYPE” which is mandatory in order to progress to next status of Physical Inventory. If the “Adjustment Type” selected is “Discrepancy” then it will be possible to add a ““SUB REASON TYPE” and this can be added at a later stage before the Physical Inventory is set to “Closed”. “COMMENT” can also be added before Physical Inventory is set to Closed.
Physical Inventory in state “Counted” – “Discrepancy report” tab
14. Once all counted lines and discrepancies have been analyzed and explained, if you are confident about what was inserted in the PI, you should get validation from your supervisor and click on the “Finished” button. The PI switches to the state “Validated“. The PI is ready to be confirmed.
15. Click on “Confirm Inventory” to confirm the PI.
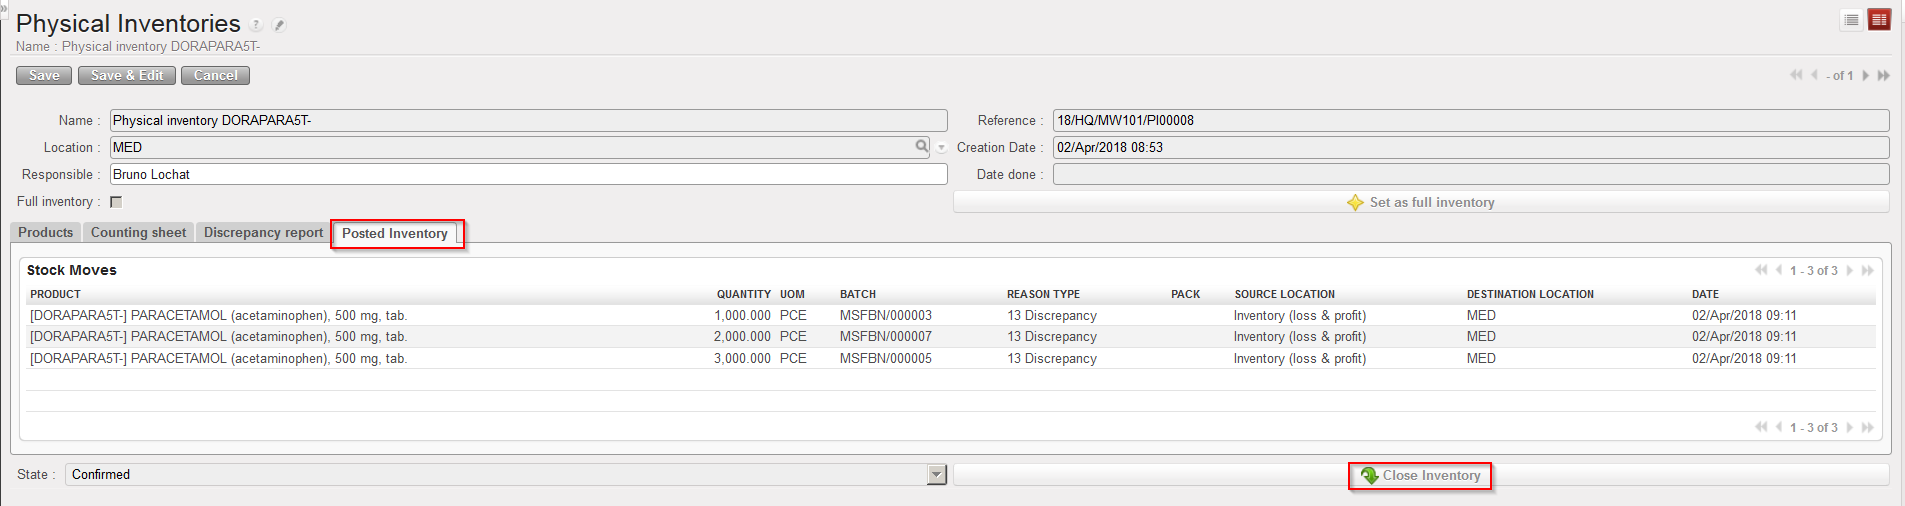
16. The PI switches to the state “Confirmed“. An additional tab called “Posted Inventory” appears, listing all movements which have been created by the PI. Click on “Close Inventory“.
Physical Inventory in state “Confirmed” – Closing the Inventory
17. The PI switches to the state “Closed“.
To end this section, we briefly comment some extra features which exist on the Physical Inventory functionality. However, it is not possible to go in all details here.
The “Set as full inventory” button allows making a full inventory (also called blanked count). The counting sheet will be empty and counters will have to count in the warehouse without any system guidance. This feature was developed to support full warehouse counts.
If you select the products to be counted via the “Products Selection” button, you may choose between:
Including the products which are currently in the location
Including the products which have recently move in/out of the location (and “recently” can be defined in month(s) between 1 and 12)
The selection of products done via one of these 2 options may also be further restricted by selecting:
All the concerned products
Products with a specific nomenclature
Products belonging to a specific list
Products which are KC/CS/DG
You may cancel a PI at any stage of its process (excepted when it is “Closed“).
When the discrepancies report is generated, if some products/batches included in the counting sheet have not been counted you may choose between:
Ignoring them (i.e. their stock level won’t be touched)
Counting them as zero (i.e. their stock level will be set to zero)
On the “Discrepancy report” tab you have the options to:
Hide ignored
Show all
Show ignored only
This allows showing/hiding ignored products/batches.
Some KPIs are available on the discrepancy report (number of lines, discrepancies value,…).
The discrepancy report can be exported/imported to/from excel. The import function is only used to import adjustment types and comments.
When the PI is in state “Counted” or “Validated“, a button allows to “re-generate the discrepancies“. This is actually a refresh button which can be useful in case you did a wrong choice on the ignore/count to zero options.
When the PI is in state “Validated“, you still have the option to click on “Recount“. This will delete the discrepancy sheet and reset the PI to the state “Counting“, allowing you to repeat the count if needed (but not to select additional products or to re-generate the counting sheet).
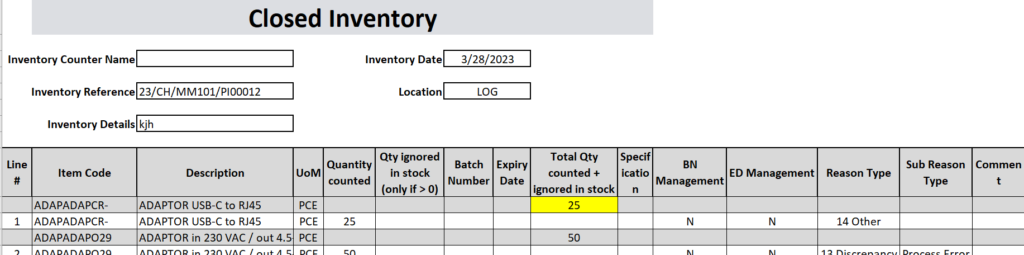
When the PI is in state “Closed” you can export a report called “Closed Inventory” via “Action menu”, similar to the Discrepancy report but with additional information: any counted qty which does not result in a discrepancy will also appear in this report.
Initial Stock Inventories are usually used when an instance is created but not after that. They help to transfer stock levels from a legacy system (e.g. LogistiX) to a UniField instance. It is a one shot operation during which accurate stock levels are introduced in UniField.
This is a process which is part of the migration when a new instance is being set up, or if a new stock location is created. This is a tool to initiate the project stocks with the relevant details (stock levels, location where the goods are, cost valuation of each product and, according to the PMD sheet settings the BN/ED if relevant).
The products, quantities and all other relevant information entered should be validated according to OC procedures.
Go to:Warehouse / Inventory Management / Initial stock inventory
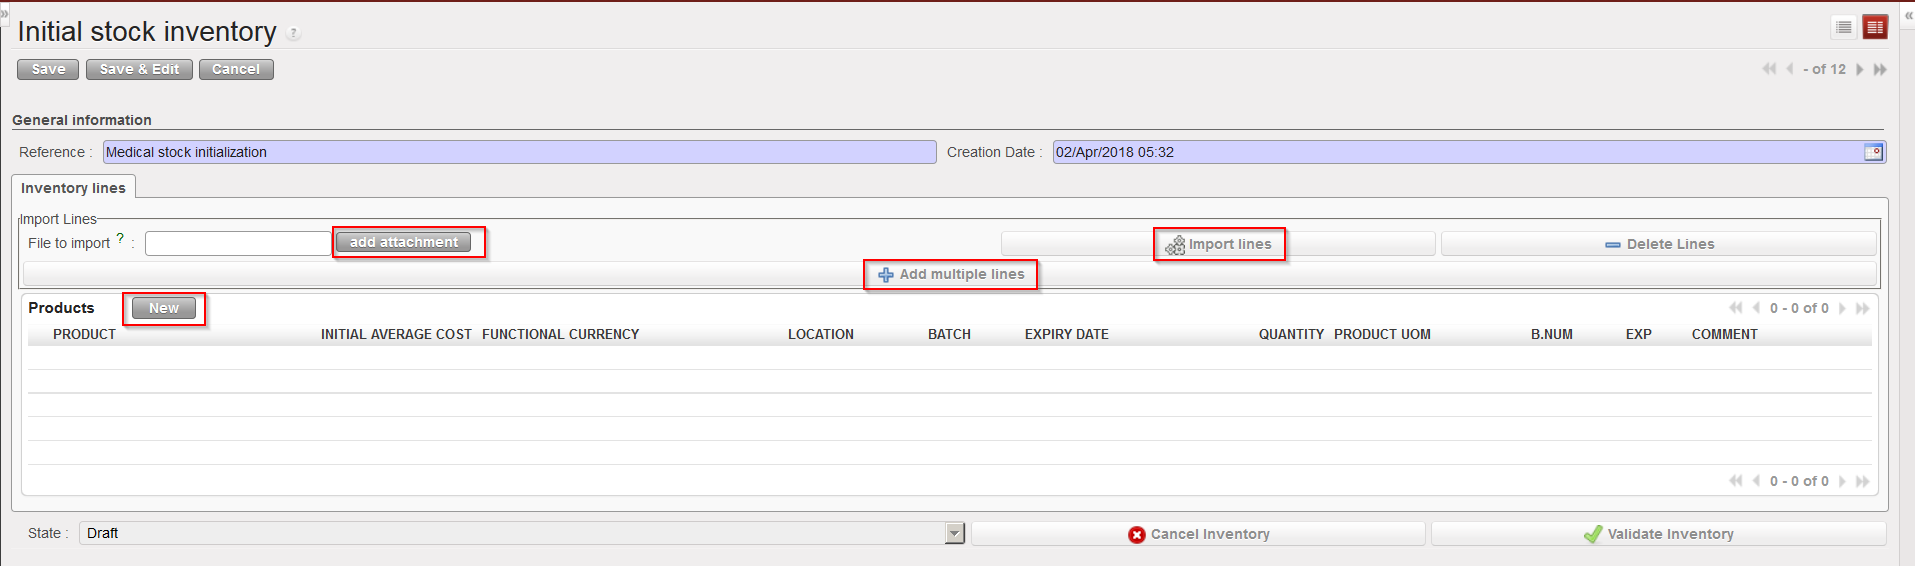
Click on the “New” button to create a new ISI.
Enter a “Reference” (name of the ISI).
The “Creation Date” is set to the current date/time by default. Change it if needed.
Add products using any of the following methods:
a) Adding products individually (by clicking on the “New” button, searching for and selecting the products).
b) Adding multiple lines by selecting .
c) Importing a file (by clicking on the “add attachment” button, browsing and selecting the file, then clicking “Import lines”). BN and ED products can be created at import, however, checks will be done at import and warning/error messages will be raised in case of conflict (existing product with same BN/ED; wrong format, missing information,…).
Methods to insert lines in an Initial Stock Inventory
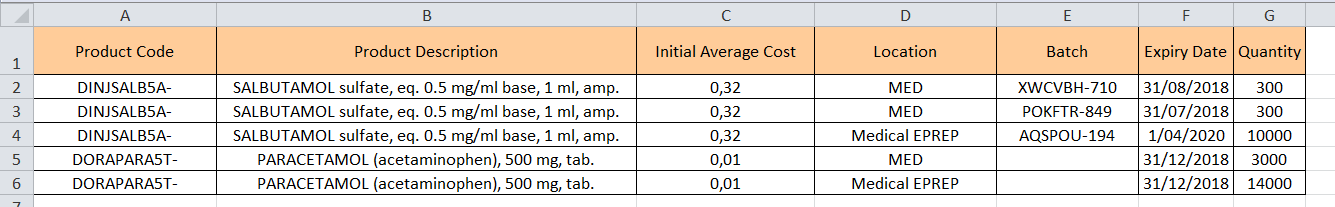
Note that imported files must have a specific format (XML Spreadsheet 2003). You may get a file template by exporting an existing ISI via the option “Stock Initial Excel Export” available in the action menu. In this file, each separate batch, expiry date or location for a product should have its own line/row.
Excel file format to import on an Initial Stock Inventory
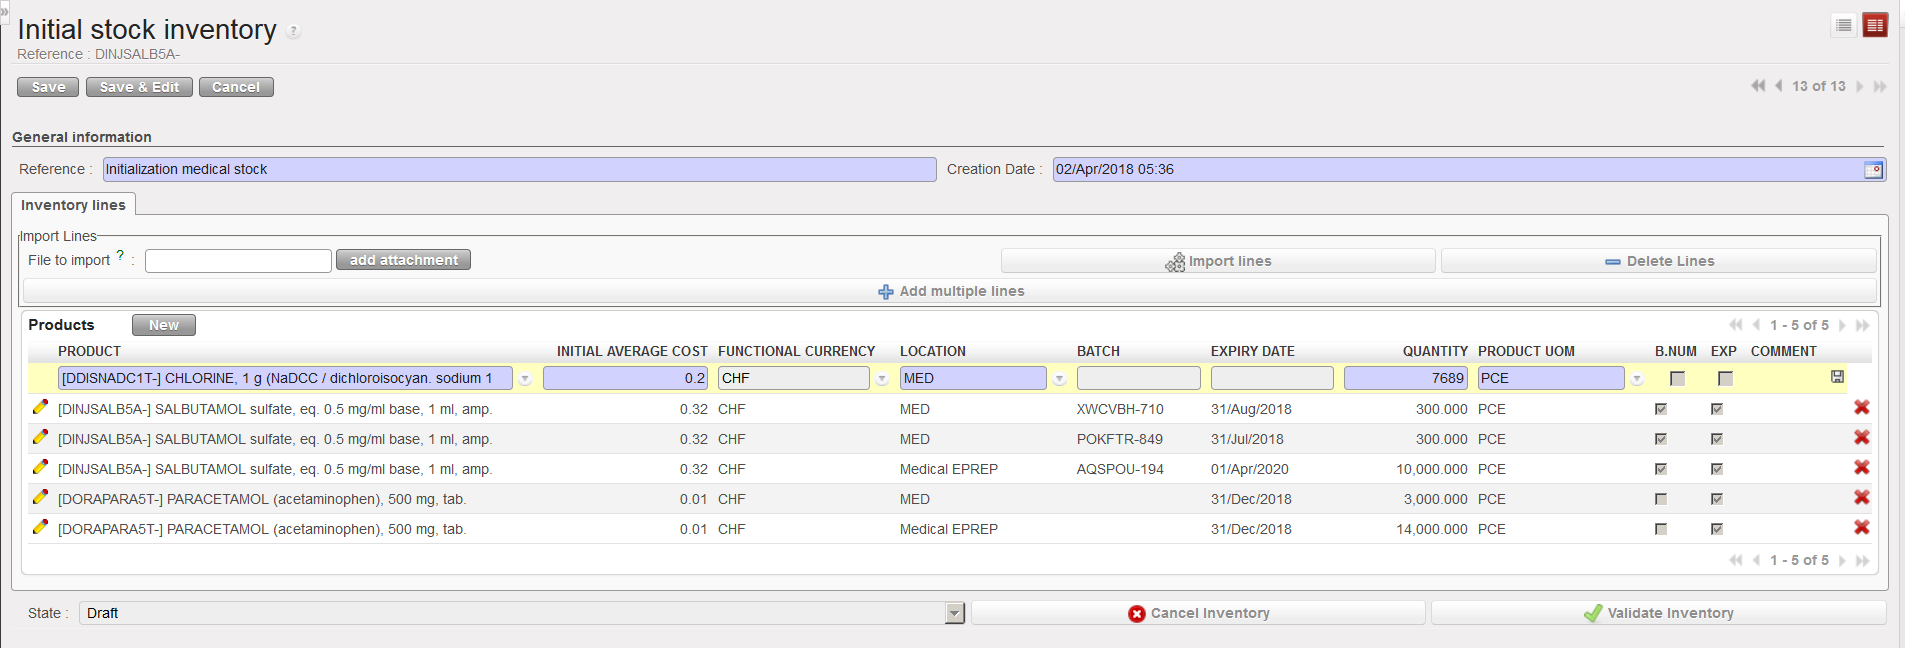
Inserting a line manually on an Initial Stock Inventory
5. Unless you used the import function (“add attachment” button) to add products and all their details, you will need to add these details manually line by line.
I.) Click on the pencil icon next to each product line to edit it.
II.) Add all relevant information (location, batch number, expiry date, quantity,…). Note that location such as Input,Output, Packing, Shipment, Distribution, Stock and Quarantine are not allowed.
III.) Click on the floppy disk icon to save each line.
6. For every product which has more than one batch number or expiry date, or is found in multiple locations, a new line with this product needs to be created.
7. Click on the “Validate Inventory” button to confirm all lines are correct, this will mean no more changes can be made.
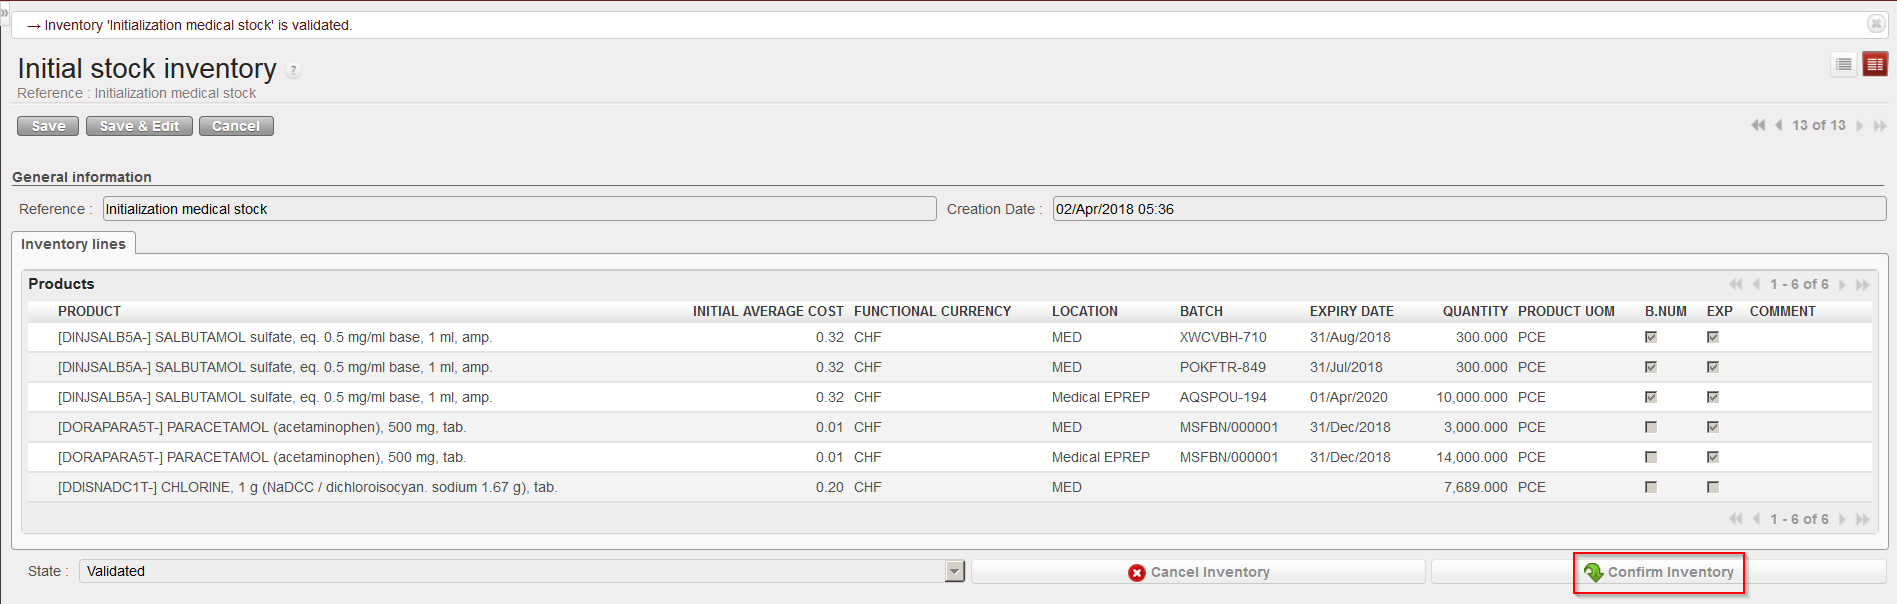
8. Once the inventory has been validated, click on the “Confirm Inventory” button to add these products into the indicated stock locations on the UniField instance.
Confirming an Initial Stock Inventory
Note that the “initialaveragecost” entered on the ISI will update the cost price of the PMD sheet. This means that the ISI will actually impact how stocks are valued in different reports and how subsequent orders will be valued. If several lines of an ISI relate to the same product, you will be forced to enter and identical unit price on the different lines.
It is not impossible to do Initial Stock Inventories several months after a go live (i.e. after an instance has been used for several months) but this should be done with great care, especially regarding price valuation of products.
Initial Stock Inventories are usually used when an instance is created but not after that. They help to transfer stock levels from a legacy system (e.g. LogistiX) to a UniField instance. It is a one shot operation during which accurate stock levels are introduced in UniField.
This is a process which is part of the migration when a new instance is being set up, or if a new stock location is created. This is a tool to initiate the project stocks with the relevant details (stock levels, location where the goods are, cost valuation of each product and, according to the PMD sheet settings the BN/ED if relevant).
The products, quantities and all other relevant information entered should be validated according to OC procedures.
Go to:Warehouse / Inventory Management / Initial stock inventory
Click on the “New” button to create a new ISI.
Enter a “Reference” (name of the ISI).
The “Creation Date” is set to the current date/time by default. Change it if needed.
Add products using any of the following methods:
a) Adding products individually (by clicking on the “New” button, searching for and selecting the products).
b) Adding multiple lines by selecting .
c) Importing a file (by clicking on the “add attachment” button, browsing and selecting the file, then clicking “Import lines”). BN and ED products can be created at import, however, checks will be done at import and warning/error messages will be raised in case of conflict (existing product with same BN/ED; wrong format, missing information,…).
Methods to insert lines in an Initial Stock Inventory
Note that imported files must have a specific format (XML Spreadsheet 2003). You may get a file template by exporting an existing ISI via the option “Stock Initial Excel Export” available in the action menu. In this file, each separate batch, expiry date or location for a product should have its own line/row.
Excel file format to import on an Initial Stock Inventory
Inserting a line manually on an Initial Stock Inventory
5. Unless you used the import function (“add attachment” button) to add products and all their details, you will need to add these details manually line by line.
I.) Click on the pencil icon next to each product line to edit it.
II.) Add all relevant information (location, batch number, expiry date, quantity,…). Note that location such as Input,Output, Packing, Shipment, Distribution, Stock and Quarantine are not allowed.
III.) Click on the floppy disk icon to save each line.
6. For every product which has more than one batch number or expiry date, or is found in multiple locations, a new line with this product needs to be created.
7. Click on the “Validate Inventory” button to confirm all lines are correct, this will mean no more changes can be made.
8. Once the inventory has been validated, click on the “Confirm Inventory” button to add these products into the indicated stock locations on the UniField instance.
Confirming an Initial Stock Inventory
Note that the “initialaveragecost” entered on the ISI will update the cost price of the PMD sheet. This means that the ISI will actually impact how stocks are valued in different reports and how subsequent orders will be valued. If several lines of an ISI relate to the same product, you will be forced to enter and identical unit price on the different lines.
It is not impossible to do Initial Stock Inventories several months after a go live (i.e. after an instance has been used for several months) but this should be done with great care, especially regarding price valuation of products.
UniField offers a variety of inventory and tracing tools to manage, search for and view all the movements of any given product. These tools facilitate the analysis and the management of the supply chain.
RR_FMC: Forecasted Monthly Consumption (the one linked to RR concepts)
RR_AMC: Average Monthly Consumption (linked to RR concepts)
RR_HMC: Historical Monthly Consumption (linked to RR concepts), the actual ‘consumption’ of a specific month in the past (unlike the AMC, which is an average consumption of several months in the past)
Std Dev (xxx): Standard deviation of the value set ‘xxx’, statistical notion which gives an idea of the spread of a data set around the average of this data set. Example: Std Dev (HMC) will be the standard deviation of the HMCs around the AMC.
Coeff Var (xxx): Standard deviation of the value set ‘xxx’ divided by the average ‘xxx’ value. Example: Coeff Var (HMC) will be the standard deviation of the HMCs around the AMC, divided by the AMC. It enables variability comparison between 2 value sets relatively to one another.
OC: Order coverage. Quantity of months to cover
TLT: Total Lead time, Qty of days/weeks/months from date of order calculation (stock take) until availability in requesting stock location. TLT = Internal LT + External LT = Preparation LT + Order Creation LT + Order Validation LT + Supplier LT + Handling LT (see mock-ups)
Preparation LT: time needed before RR cycle begins to do tasks such as complete physical inventories, update FMCs and other related discussions
Order Creation LT: time from user starting to look at next OC period to when IR has been creation
Order Validation LT: time from IR creation until PO validation
Supplier LT:time from validated PO until reception at requested location.
Handling LT: time for customs clearance (e.g. from reception at port to reception at Instance Warehouse (can be zero e.g. for internal suppliers)
SS: Safety stock in months of consumption
TCRP: Time Covered by Replaced Product. When a product replaces an older product, this is the duration before the product to be replaced reaches Stock = 0.
Buffer: (additional or alternative) Safety stock as quantity
STDate: Stock take date (most of the time, this is the order calculation date)(this date is a point in time and can be considered as point 0 or starting point/date for calculations below)
RDD: Requested Delivery Date of the order being currently calculated. The default theoretical RDD in FMC-segments equals ‘STDate + TLT’
SODate = Stock Out Date. Date when the estimated projected stock will reach 0 (using RR_FMCs)
Real Stock: this including all current Qty in stock including reserved stock but not already expired stock: It includes all physical stock (including Buffer and Safety stock)
Reserved Stock: all AVAILABLE lines in PICKs and OUTs (current definition in Unifield 13)
PAS: Projected Available Stock. This gives forecast/projection at stock availability at end of TLT, which is the RDD. (reserved stock is not separated out in this calculation)
IOH = Inventory On Hand = Real Stock
MissQty = Missing Quantity (aka Qty lacking) before order arrival
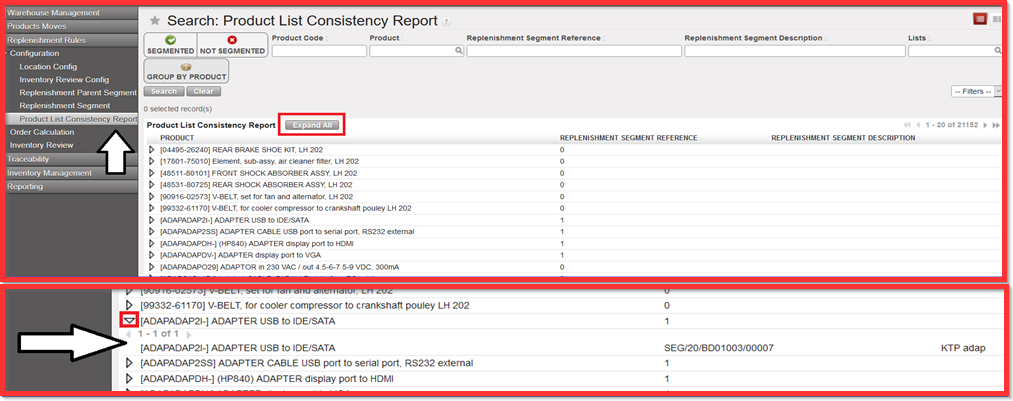
M. HOW TO GENERATE A PRODUCT LIST CONSISTENCY REPORT
Go to:Warehouse /Replenishment Rules/ Configuration/ Product List Consistency Report
Product List Consistency Report is used for each of the products from RR. The purpose of the report is to cross check products to which segment belong to. It enables to see how many Replenishment Segments each product is in (overview) or whether it is not in any Replenishment segments. It considers only lower level of segments – Replenishment segment (child segments) where the products are added. Thus “Replenishment Parent Segment” is not part of Product List Consistency Report.
Click on sub menu “Product List Consistency Report”
Click on button “Expand All”. You get the detailed breakdown description of each product as depicted on picture below.
If you click on the small arrow at product line level you get the breakdown on clicked product only.
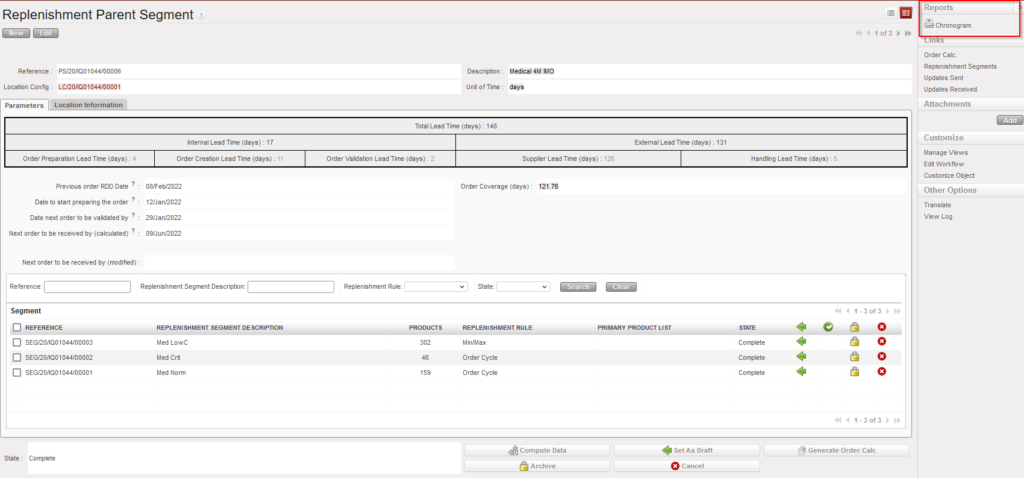
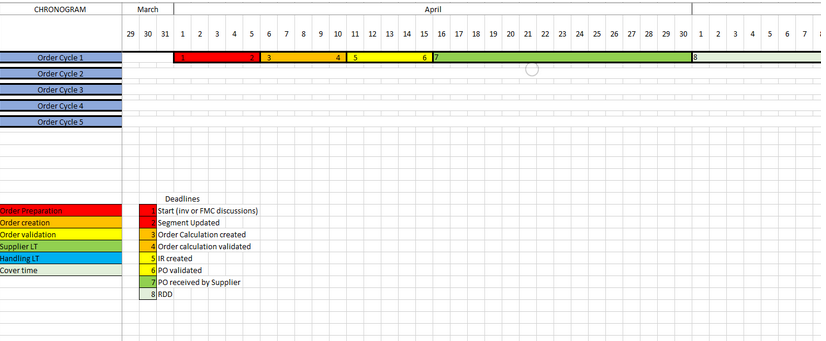
Note: its possible to export the Chronogram diagram in excel format from the Action menu of the Replenishment Parent Segment screen. It gives an overview of a 2 year planning horizon showing up to 5 order cycles based on the dates entered in the Parent segment, with indications of lead times/key dates for order preparation, order creation and order validation, Supplier and Handling lead times as well as the cover time of the order. Chronogram will be generated using Unit of time selected in segment (days/weeks/months). Some restrictions have been added to ensure unit of time selected is pertinent to lead times added along with a warning to indicate these.
Go to: Warehouse / Replenishment Rules / Configuration / Replenishment Parent Segment / Reports
K. HOW TO GENERATE ORDER CALCULATION REPORTS – Exports and on screen
From list view of Order Calculations, it is possible using the check-boxes to select multiple Order calcs and then, using some other options in the Action Menu in order to generate reports in excel files.
These exported reports can still be used as import file in order to update the Order Calc (when not Closed yet).
Go to:Warehouse / Replenishment Rules / Order Calculation
Export files from right end side Action menu
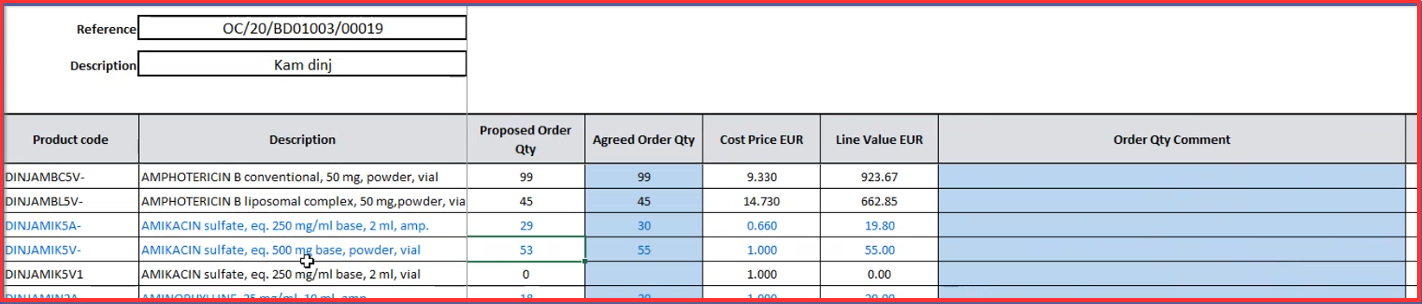
a) Order Calc Excel Export :
This report enables to have a visibility on what is present in our order calc. There is an option to export either a report with all lines or a report with Warning lines. If you export the excel spreadsheet file there are two columns visible (colored in blue) “Agreed Order Qty” and “Order Qty Comment”. These blue highlighted columns can be edited/updated and are accepted by the system when you import the excel spreadsheet back to Unifield system. It is possible to export all lines for selected Order Calcs into one excel file for order calcs which are in Draft Status.
The only check made by system before exporting is that the Order Calcs are in Draft status (the order calcs can have differing OC, LTs, RDDs). The export would have the same format at line level as the current Order Calc export, with 5 additional columns: Order Calc Ref, Time Unit, Total lead time, Order Coverage and Safety Stock.
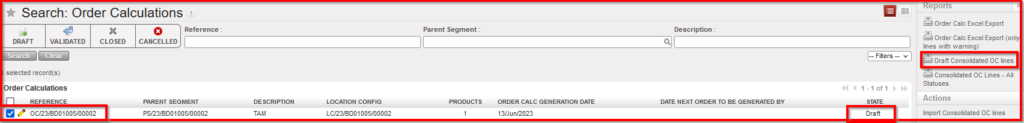
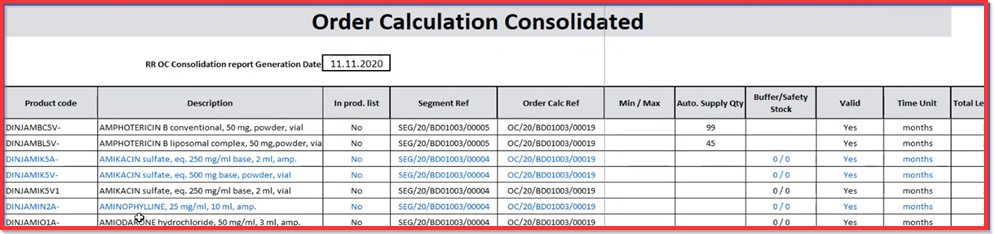
b) Draft Consolidated OC Lines :
This file (Draft consolidated) can be imported via the Action menu, with the exact same format, and like the existing singular import, this would update the 2 fields “Agreed Order Qty”, and “Order Qty Comment”, for all lines on all Order Calcs. It can be used for as many DRAFT Order Calc as you want without any limitation.
There is a column with reference of the selected Order calc (“Order Calc Ref”).
i) Select the Draft Order Calcs to consolidate
ii) Click on “Draft Consolidated OC Lines” from the right end action menu
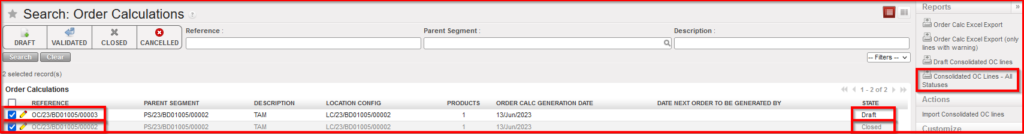
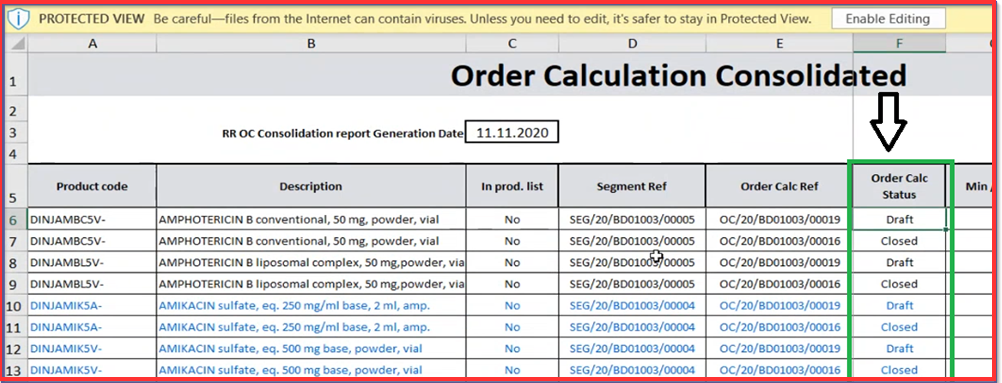
c) Consolidated OC Lines – All Statuses:
Export all lines for selected Order calc into one excel file and Order calcs can be any status (including Closed) this does not need to be importable, same format as above but with extra column for OC status. “Consolidated OC Lines – All Statuses” gives you a better overview from pharma point of view. The report layout is the same, additional column of “Order Calc Status” is visible as depicted on the picture below.
i) Select the Order Calc (any status) to consolidate
ii) Click on “Consolidated OC Lines – All Statuses” from the right end action menu
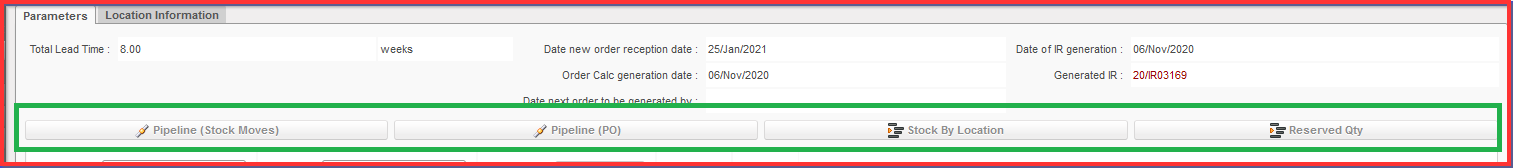
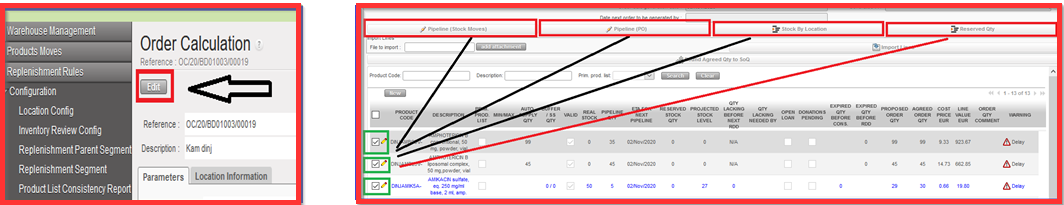
2. On screen reports available via button on main Order Calc screen
a) “Pipeline (stock moves)”/ “Pipeline (PO)”
The reason why we have two types of Pipeline is that there is an historic pipeline based on Stock moves and created at PO confirmation (i.e.: there is a new stock move with an “IN” already available); this is the “Pipeline (stock moves)”.
The second recently developed Pipeline calculation starts at PO line Validation which gives more visibility and flexibility as regard of ESC PO management processes; this is “Pipeline (PO)”.
b) “Stock by Location”
The ”Stock by Location” button is directly linked to report available in menu: Products> Product in right end action menu. It is a top-level overview which is used in Order Calculation product detailed view. Stock by Location is linked to the product.
c) “Reserved Qty”
Reserved Qty is linked to reserved stock. Basically, as soon as the product line is “Available” in the PICK, it is considered as reserved. The first PICK is reserving the stock as “available” meaning that it is available also for next location/ doc.
Generally, there are two options of Reserved Qty definition as we are sending the goods from stock to the project based on RR cycle needs (consumption wise) or second option that stock is reserved and goods are sent out to someone else (not in charge of RR).
In order to use these buttons, Order Calc view should be in Edit mode in order to be able to select the desired products. Next step is selecting of buttons (as depicted on the pictures below).
We use cookies to ensure that we give you the best experience on our website. If you continue to use this site we will assume that you are happy with it.

 .
.