Supply User Manual ENG -> Products -> 3.6 LU-SU2105: Kits/Modules -> F. Kit Management: Compare KCL and TKC
1 Overview
The Compare KCL and TKC function is a reporting tool within the Kit Management module that allows you to generate a Missing Components report. It compares the actual contents of a Kit Composition List (KCL) against the Theoretical Kit Composition (TKC) — the standard expected composition of that kit type.
The report is exported as an Excel file (.xlsx) and is designed to help supply and warehouse teams:
- Quickly assess the completion status of kits held in stock.
- Identify items that are missing or in lower quantities than expected.
- Support replenishment planning and needs assessments.
- Track kit quality using deviation KPIs.
Understanding the two documents being compared:
|
KCL — Kit Composition List |
TKC — Theoretical Kit Composition |
|
|
Definition |
The actual contents of a physical kit currently in stock |
The standard / expected composition for that kit type (the template) |
|
Purpose |
Records what is in the kit |
Defines what should be in the kit |
|
Status for comparison |
Must be Completed or Closed |
Referenced via the TKL version linked in the KCL |
TIP: Closed KCLs include kits or modules that form part of a parent kit — these are eligible for comparison.
NOTE: Matching between KCL and TKC lines uses a degressive approach: first matching on Product + Quantity + Batch/Expiry Date, then Product + Batch/Expiry Date, then Product only. This ensures the most accurate comparison possible.
2. Step-by-Step: Generating the Report
Follow the steps below to generate the KCL vs TKC Comparison Report.
|
1 |
Open the Supply module Log in to UniField and click Supply in the main navigation menu. |
|
2 |
Go to Kit Management Select Kit Management from the left-hand or top navigation bar. |
|
3 |
Open Kit Composition Lists Click on Kit Composition Lists (KCL) to view the list of all KCLs. |
|
4 |
Filter and locate your KCL Use the search and filter options to find the KCL you want to analyse. Look for KCLs with a Completed or Closed status. |
WARNING: Draft or in-progress KCLs cannot be used for comparison. If your KCL is still in progress, complete or close it first.
|
5 |
Open the KCL Click on the KCL row to open the record and review its details. |
|
6 |
Confirm the TKC version is linked In the KCL header, verify that a TKC version (TKL) is referenced. This is the standard against which your report will compare. |
The screen below shows a typical KCL record in Completed status, ready for comparison:
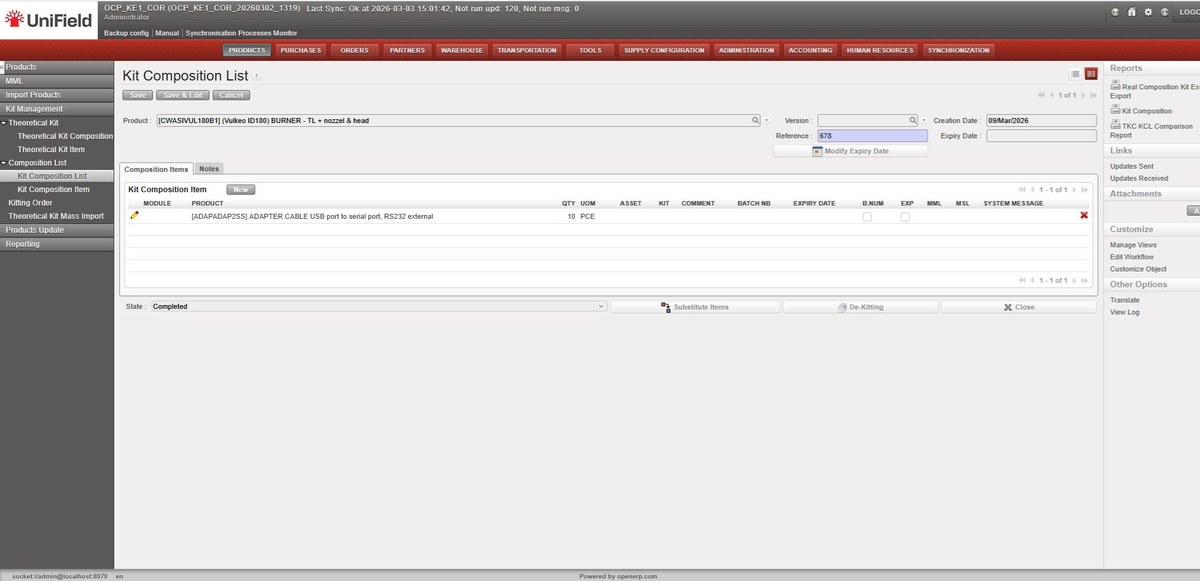
Figure: Kit Composition List — Completed status, showing product, version, reference and composition items
|
7 |
Open the right-side action menu With the KCL open, locate the Actions or right-side menu panel. |
|
8 |
Click “TKC KCL Comparison Report” Select this option from the Reports section of the right-side panel. It is only visible for KCLs with Completed or Closed status. |
The TKC KCL Comparison Report link is located in the Reports section of the right-side panel (highlighted below):
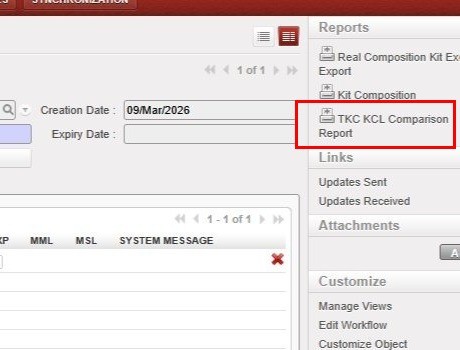
Figure: Right-side Reports panel — TKC KCL Comparison Report button (highlighted)
|
9 |
Save or open the Excel report UniField will generate the report automatically and prompt you to download or open the .xlsx file. |
TIP: The report is generated in Excel format (.xlsx) so that supply teams can use it for filtering, further analysis, or sharing with other stakeholders.
3 Report Layout and Content
The generated Excel report uses layout: TKC columns appear first (columns A–F), followed by KCL columns (columns G–M, highlighted in light green). This order reflects the operational logic used by warehouse teams — starting from what is expected in a kit, then comparing with what is actually present.
Report Header: The top section of the report displays summary information about the kit:
- Kit (Product) Reference
- Kit Creation Date
- TKC Version (TKL)
- Batch Number and Expiry Date
- Date the Report was Generated
The screenshot below shows an example report generated for kit KMEDMEBO05A (Ebola VHF Sampling module), including TKC and KCL details and the Comparison Summary section:
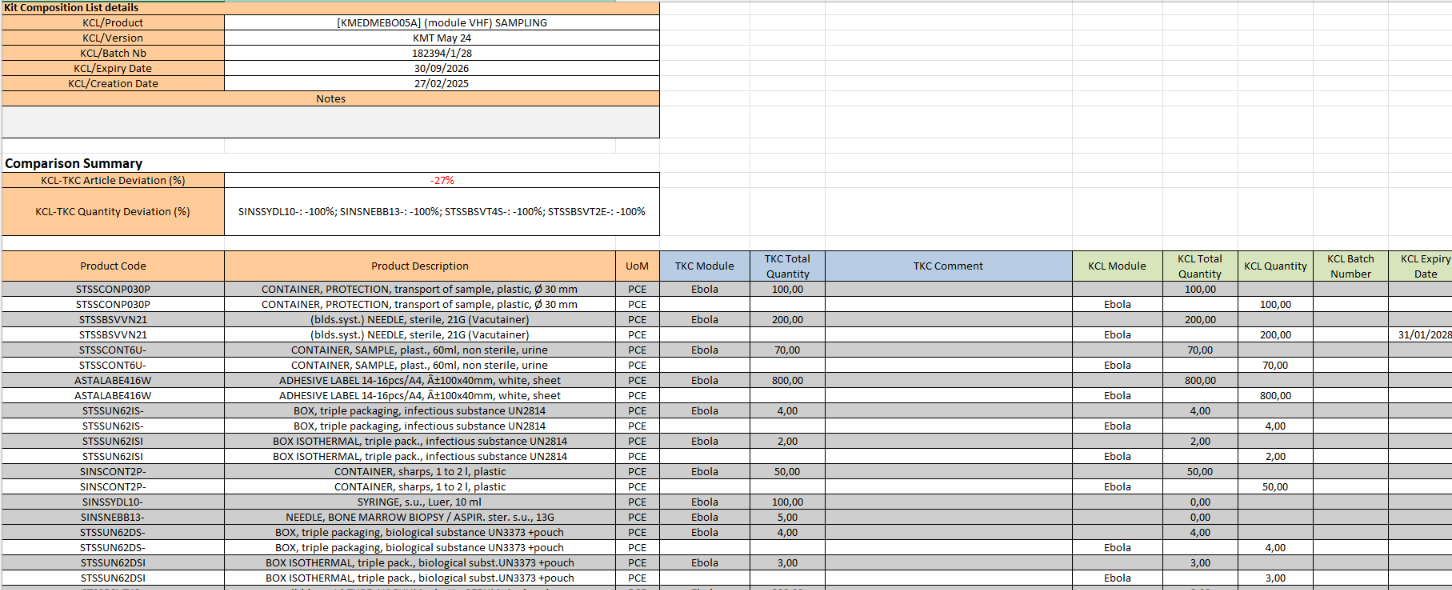
Figure: TKC KCL Comparison Report — header, TKC & KCL details, Comparison Summary and product lines (KMEDMEBO05A, batch 182394/1/28)
Report Columns: Each row in the report represents a product line. Columns are split between TKC (expected) and KCL (actual) data:
|
Column |
Section |
Description |
|
Product Code |
TKC |
Product reference from the Theoretical Kit Composition |
|
TKC Quantity |
TKC |
Expected quantity per the TKC standard |
|
TKC Batch No / Expiry Date |
TKC |
Batch number and expiry date from the TKC |
|
TKC Comment |
TKC |
Any comment recorded on the TKC line |
|
KCL Module |
KCL |
The module within the KCL — positioned between TKC Comment and KCL Total Qty |
|
KCL Total Quantity |
KCL |
Actual total quantity of the product found in the kit |
|
KCL Batch No / Expiry Date |
KCL |
Actual batch/expiry of products in the kit |
|
Deviation |
Summary |
Difference between KCL and TKC quantity (+/−) |
NOTE: The KCL Stock Location column is not included in the report. The focus is on product references and quantities, not physical storage locations.
4. Comparison Summary and KPIs
The report includes a Comparison Summary section with two key performance indicators (KPIs) that provide an at-a-glance view of kit completion status. These KPIs follow the same logic as the PO vs Catalogue mismatch reporting already familiar to UniField users.
|
KPI |
Formula |
What it Tells You |
|
KCL–TKC Article Deviation (%) |
((# codes in KCL − # codes in TKC) / # codes in TKC) × 100 |
Positive = more product types in KCL than expected. Negative = product types are missing from the KCL. |
|
KCL–TKC Qty Deviation (%) per product |
((Qty in KCL − Qty in TKC) / Qty in TKC) × 100 |
Shown per product. 0% is excluded. Negative values appear in red in the report summary. |
Quantity Deviation — Worked Examples:
|
Scenario |
KCL Qty |
Calculation |
Deviation |
|
Kit complete |
100 (matches TKC of 100) |
(100 − 100) / 100 × 100 |
0% — excluded from summary |
|
Slight shortage |
95 (TKC requires 100) |
(95 − 100) / 100 × 100 |
−5% (highlighted red) |
|
Surplus |
110 (TKC requires 100) |
(110 − 100) / 100 × 100 |
+10% |
|
Major shortage |
60 (TKC requires 100) |
(60 − 100) / 100 × 100 |
−40% (highlighted red) |
NOTE: Negative deviation values are highlighted in red in the Comparison Summary. 0% deviations are excluded from the Quantity Deviation field to keep the summary uncluttered.
TIP: If all items match the TKC exactly, the summary will show 0% deviation or display a message confirming the kit is complete with no missing items.
