Supply User Manual ENG -> 5. Warehouse -> 5.18 LU-SU4304: Movements Reports.
LU-SU4304: Movements Reports.
C. MOVES ANALYSIS/IN & OUT REPORT
E. HOW TO GENERATE THE “Receptions Report“
Supply User Manual ENG -> 5. Warehouse -> 5.18 LU-SU4304: Movements Reports.
C. MOVES ANALYSIS/IN & OUT REPORT
E. HOW TO GENERATE THE “Receptions Report“
Supply User Manual ENG -> 5. Warehouse -> 5.17 LU-SU4303: Management of Expiry Dates -> D. HOW TO PRODUCE A PERIODICAL FORECAST REPORT
This report also uses FMC/AMC/RAC according to your choice. It calculates what will be the evolution of the stock in a specific location within X weeks/months as from today.
This report exports all products as requested according to filters. In the generated file, in the forecast for weeks/months shown, stock quantity should not fall below 0 (i.e. no negative quantities).
In addition to this, for the pipeline quantity, when calculated for LOG/MED locations, the report take into account the pipeline according to what is coming into the warehouse when PO is Validated (i.e. via input) . This means that the virtual stock from a Validated PO will be considered also.
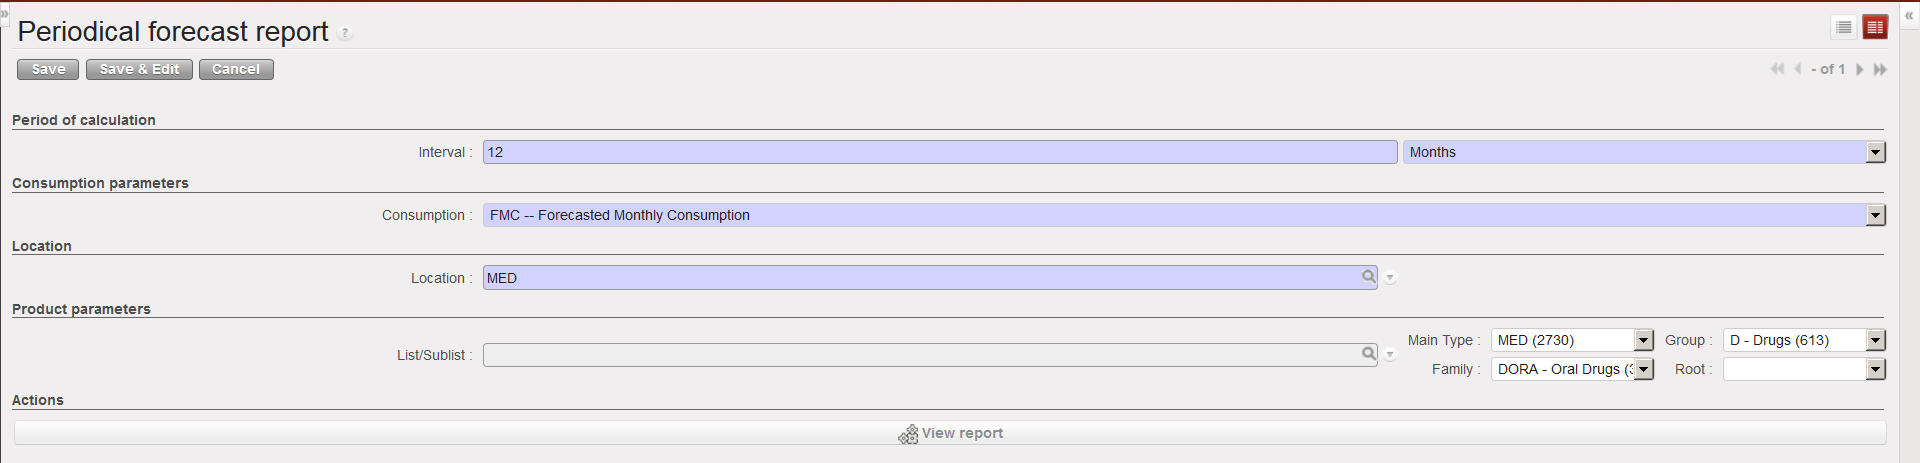
Go to: Warehouse / Reporting / Expiry /Periodical Forecast Report
|
|
|
Periodical forecast report – selection screen |
|
|
|
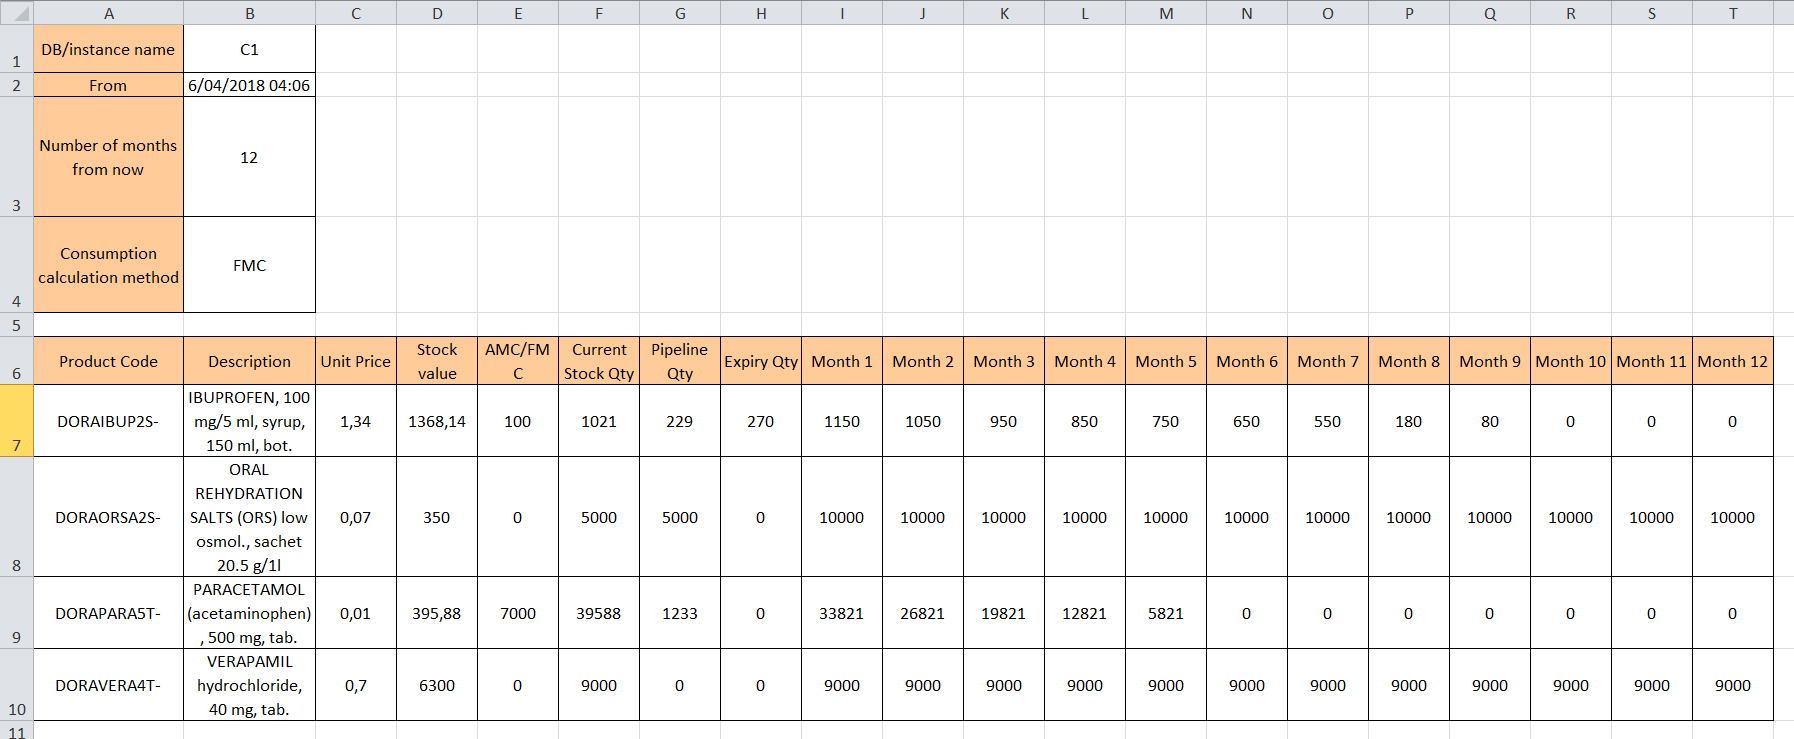
Periodical forecast report – Excel report |
An excel file is generated. On the top of the sheet you can see a summary of the parameters entered in the selection screen.
The table shows the following columns:
Supply User Manual ENG -> 5. Warehouse -> 5.17 LU-SU4303: Management of Expiry Dates -> C. HOW TO CHECK EXPIRATION OF KITS COMPONENTS
The general tools for checking expiry dates will only take into account the overall expiry date associated with a whole kit. In some cases, a kit may contain components which will expire on different days.
By default, the kit should be associated with the earliest expiry date, but it could still be useful to check the expiration of each of the kit’s components. Please note that it will only be possible to check this for kits which have a Kit Composition List.
Go to: Products / Kit Management / Composition List / Kit Composition Item
|
|
|
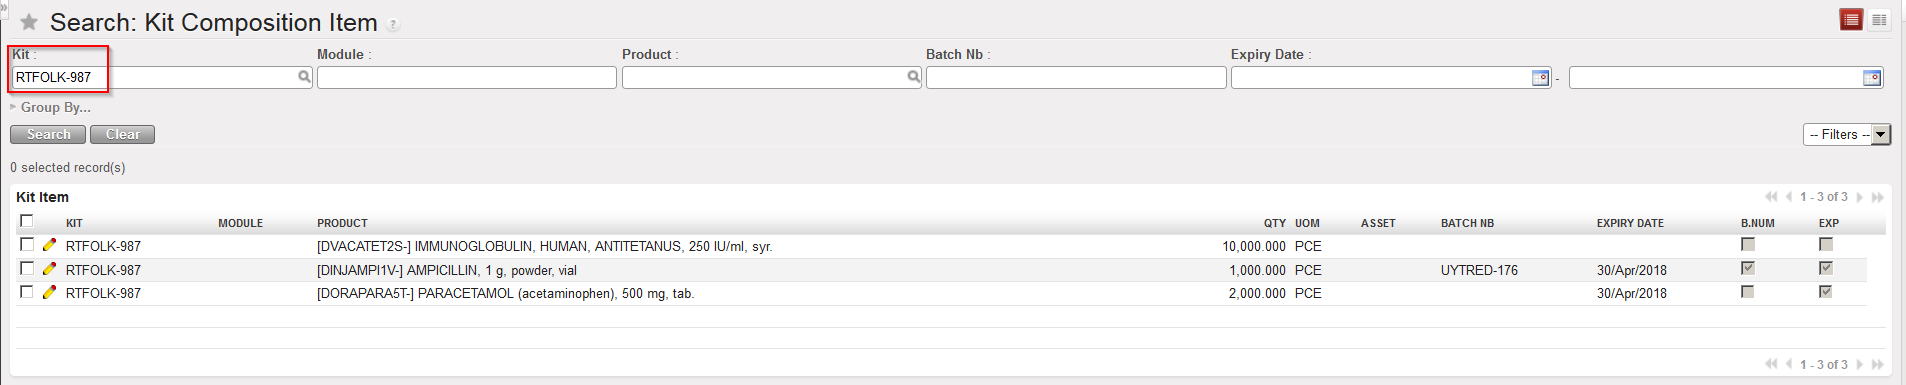
Kit Composition Item |
The report shows all the components of the kit with their batch number and/or expiry date if relevant.
Note that filters and the “Group by” may be used in different ways.
Supply User Manual ENG -> 5. Warehouse -> 5.17 LU-SU4303: Management of Expiry Dates -> B. PRODUCTS LIKELY TO EXPIRE
This tool shows the products with their respective quantities which are likely to expire, based on the defined Forecasted Monthly Consumption, Average Monthly Consumption, RR-Average Monthly Consumption or Real Average Consumption. This should be helpful in preventing products from expiring before being used or sent where they can be used by giving visibility.
Go to: Warehouse / Reporting / Expiry / Products likely to expire
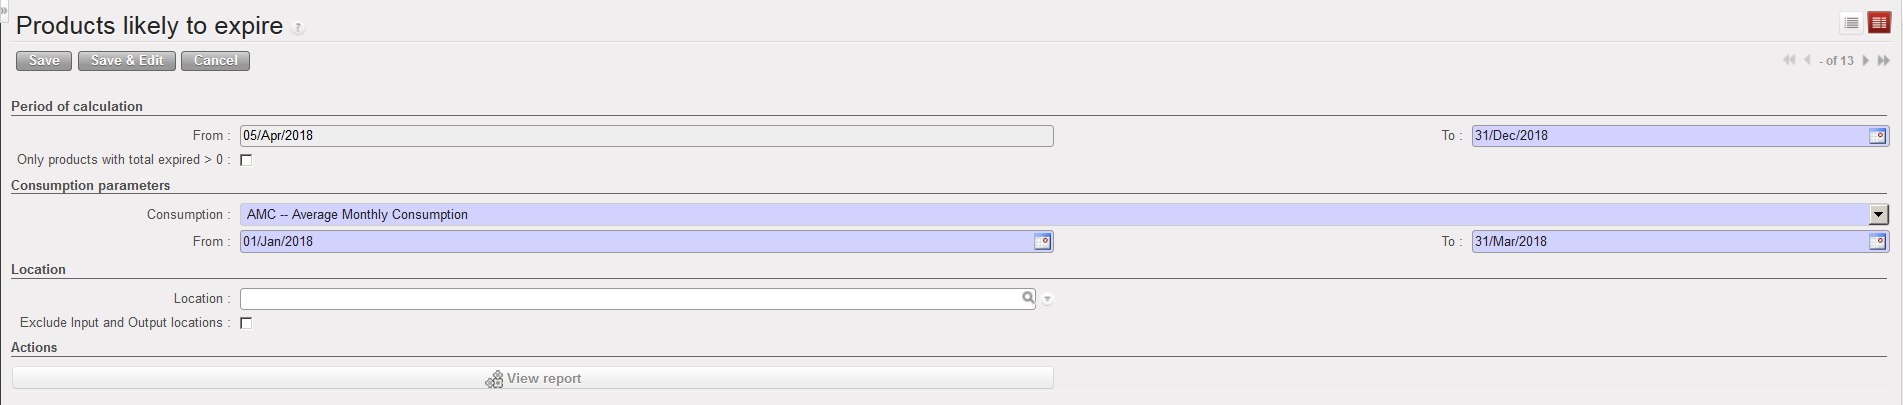
5. Enter the location which should be investigated (if nothing is entered, all internal locations will be looked at).
6. You may exclude the “Input” and “Output” locations if you tick the corresponding checkbox.
7. Click on the “View report” button.
![]() |
| Products likely to expire – selection screen |
![]() |
| Products likely to expire – report |
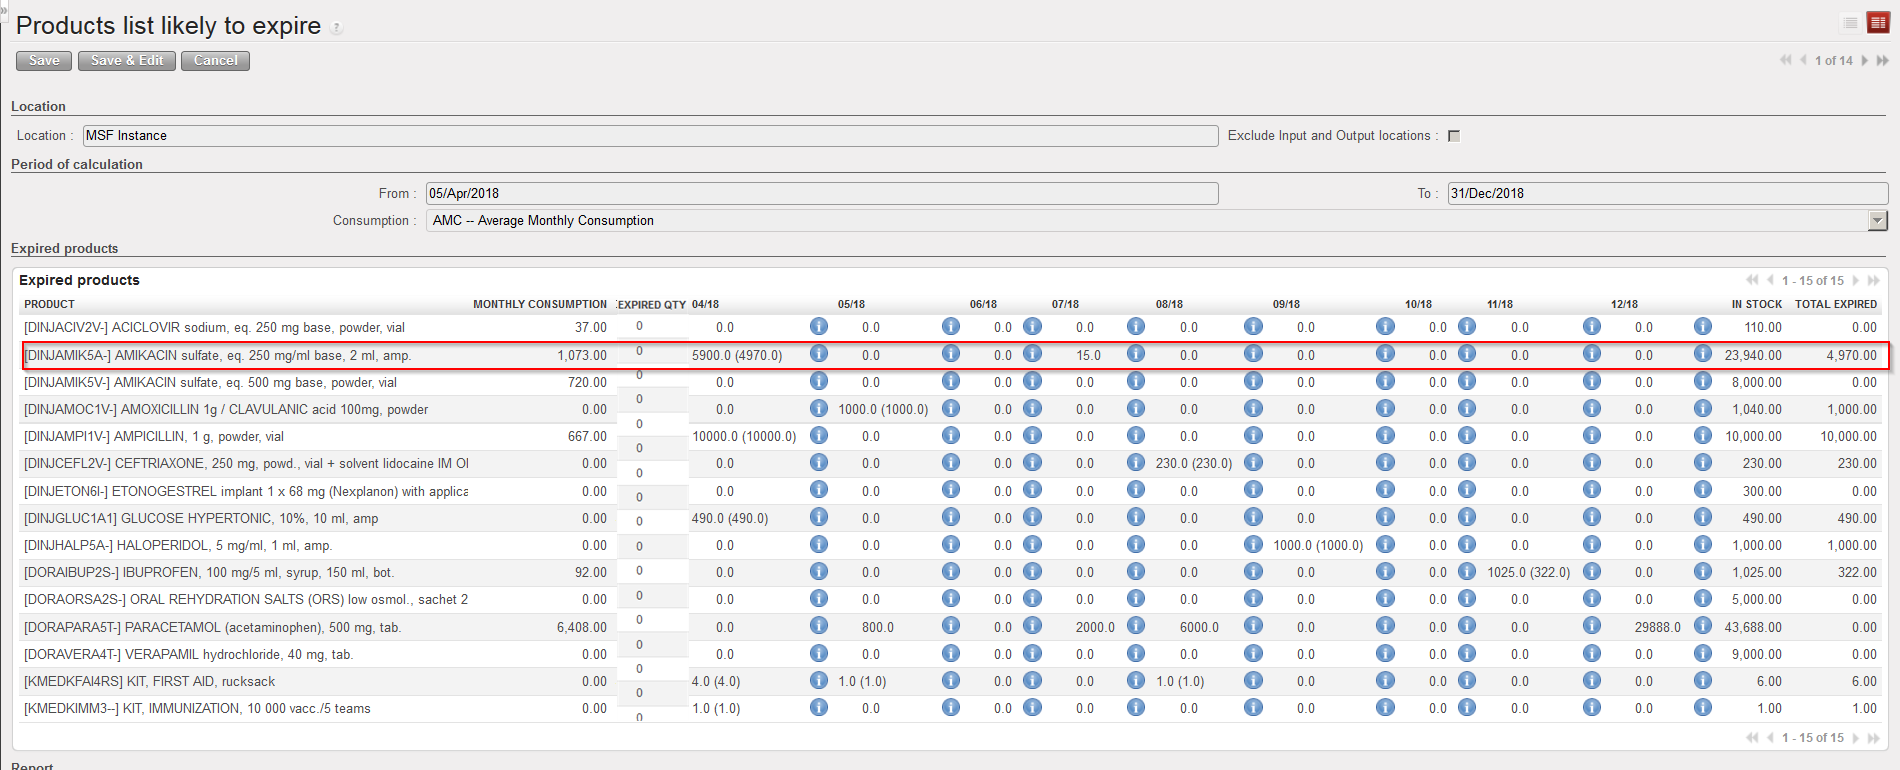
An on-screen report appears with the products which are likely to expire.
In the “Monthly consumption” column, the FMC/AMC/RR-AMC/RAC appear according to the choice done in the selection screen.
Note that the following column displays the “Already Expired Qty”. The next columns will show each month within the period of calculation entered in the selection screen. Under each month, you can see a first number and next to this, if relevant, another number (between brackets).
If we look at the above example, this means that 5900 amps of DINJAMIK5A- will expire in April if nothing is consumed. But if we consider that some of this quantity will have been consumed by then (in this case using the AMC which is 1073 amps per month), then only 4970 amps of DINJAMIK5A- will expire in April because the rest will have been consumed.
Today is the 05/04/2018. This means that 26 days remain before the end of the current month.
The AMC is 1073 amps per month. This means that the daily average consumption is 35,77
During the 26 remaining days in April, we will consume 929,93 amps
We have a stock of 5900 which will expire on the 30/04/2018.
This means that at the end of the month, we will remain with 4970 expired amps not consumed.
The “In stock” column shows the real stock level which is currently in the selected location (or on the instance if no location was selected).
The “Total expired” column shows the quantities which are going to expire between today and the end of the period of calculation (considering that the products will be consumed according to the selected rate).
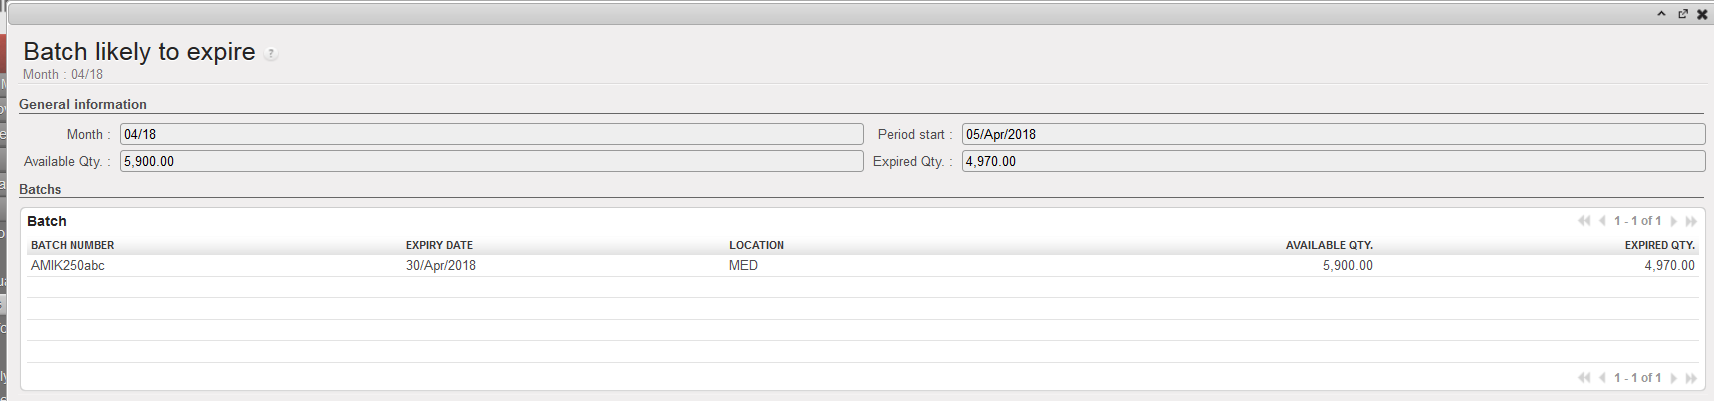
If you wish to see more information about a particular product which will likely expire, click on the
icon next to the numbers. A screen opens to display more information on the batch(es) which will likely expire.
![]() |
| Batch likely to expire |
The “Print report PDF” and “Print report Excel” allow to export the report in PDF/Excel.

![]() |
| How to export the report tin PDF or Excel |
Note that the Excel Export will present several tabs: the first one will display the same information as on screen “Products likely to expire” with an overall view, while the other tabs will be displayed by expiration month (except for the already “Expired” tab) and provide more detailed information (Location, BN and ED…).
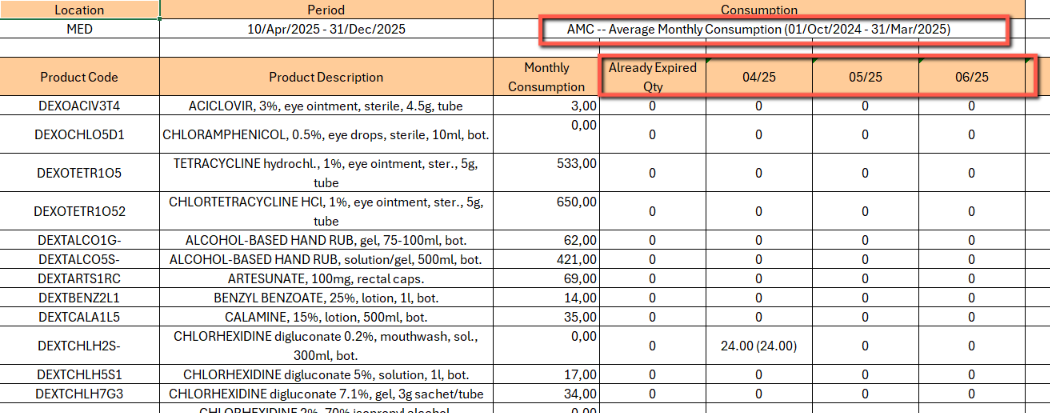
![]() |
| Excel Export for Products likely to expire – overview tab |
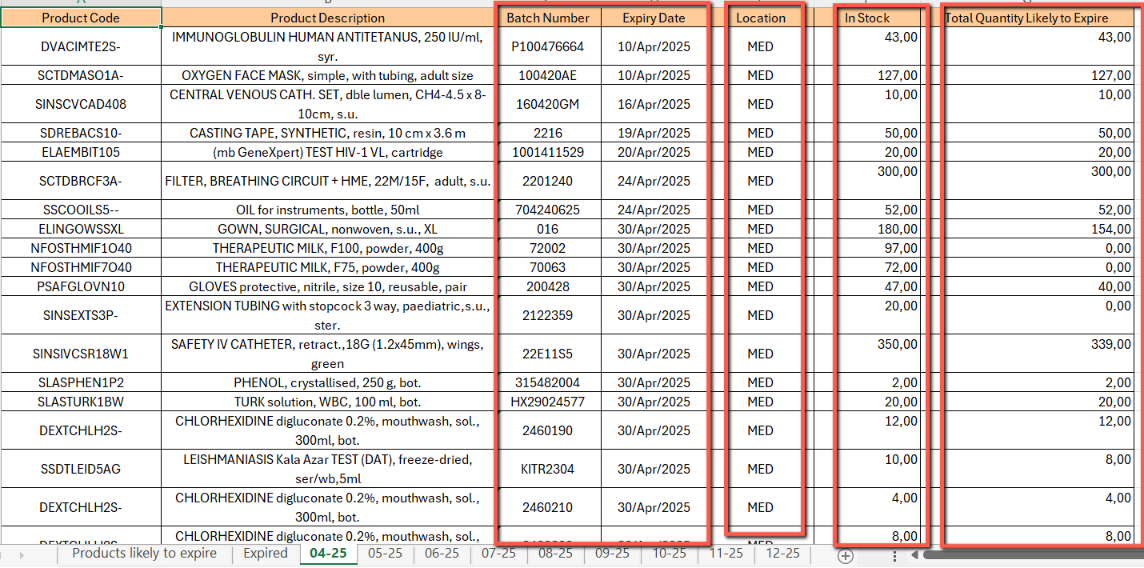
![]() |
| Excel Export for Products likely to expire – view per expiration month |
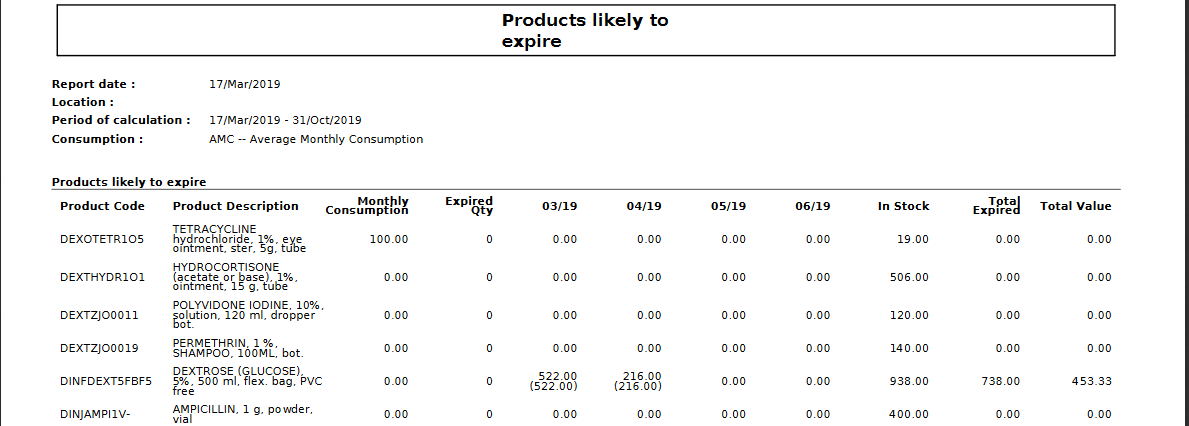
![]() |
| PDF Export for Products likely to expire |

Supply User Manual ENG -> 5. Warehouse -> 5.17 LU-SU4303: Management of Expiry Dates -> A. EXPIRY QUANTITIES
This report allows to see batches/quantities already expired and batches/quantities which will expire within XX weeks. It is actually a simple “picture” of batches in your instance.
In addition, the system also calculates the quantities which are probably going to expire before use using the Real Average Consumption (RAC) in the calculation.
Go to: Warehouse / Reporting / Expiry / Expiry Quantities
|
|
|
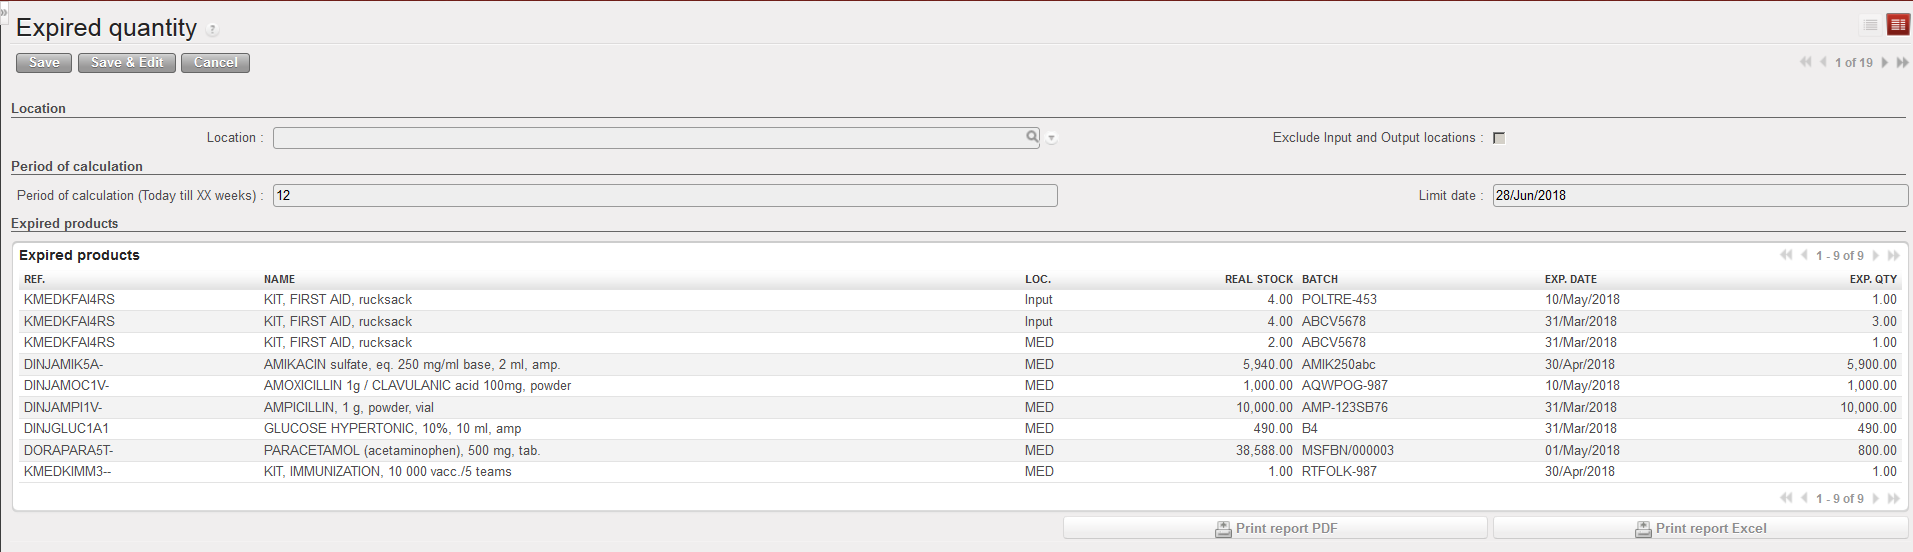
Expiry quantities – selection screen |
|
|
|
Expiry quantities – report |
An on-screen report is produced. Expired batches and batches which will expire within XX weeks are showed. The current real stock per product and location (not per batch) is also showed.
The “Exp. Qty” column shows, for each batch, the quantity which is probably going to expire before use in the involved location. This quantity is calculated using as information: stock in hands, expiry dates and the RAC.
The “Print report PDF” and “Print report Excel” allow to export the report in PDF/Excel.
Supply User Manual ENG -> 5. Warehouse -> 5.17 LU-SU4303: Management of Expiry Dates
C. HOW TO CHECK EXPIRATION OF KITS COMPONENTS
D. HOW TO PRODUCE A PERIODICAL FORECAST REPORT
Supply User Manual ENG -> 5. Warehouse -> 5.16 LU-SU4302: Stock Inventory Reports -> J. EXPORT STOCK & PIPE REPORT (HQ ONLY)
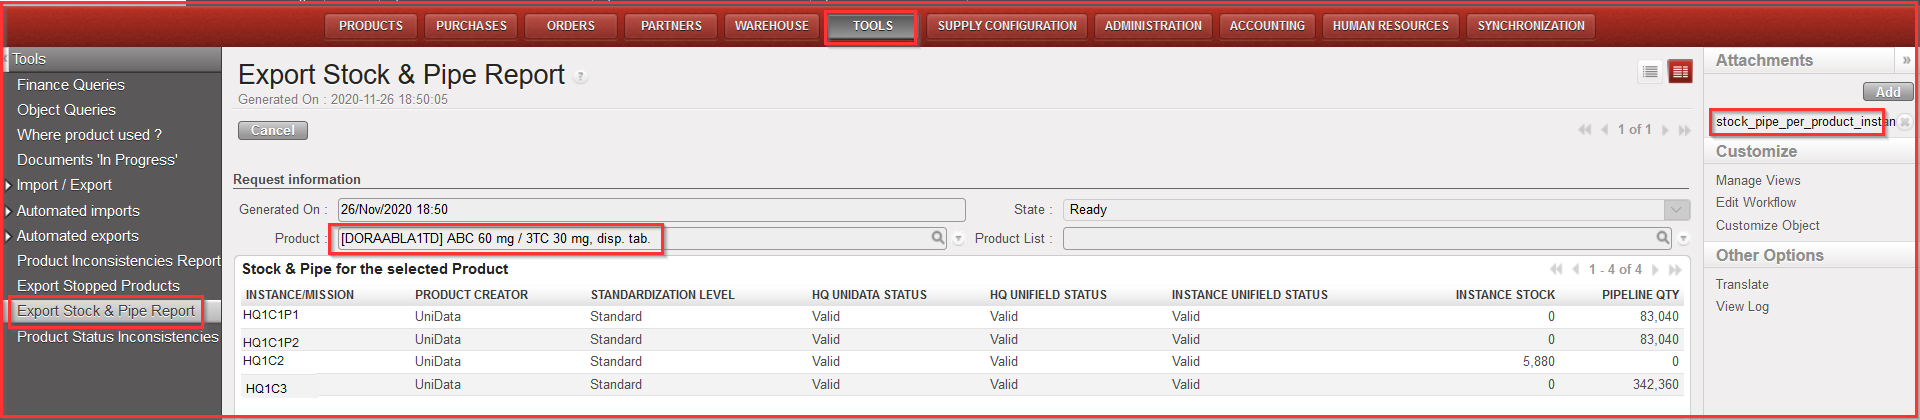
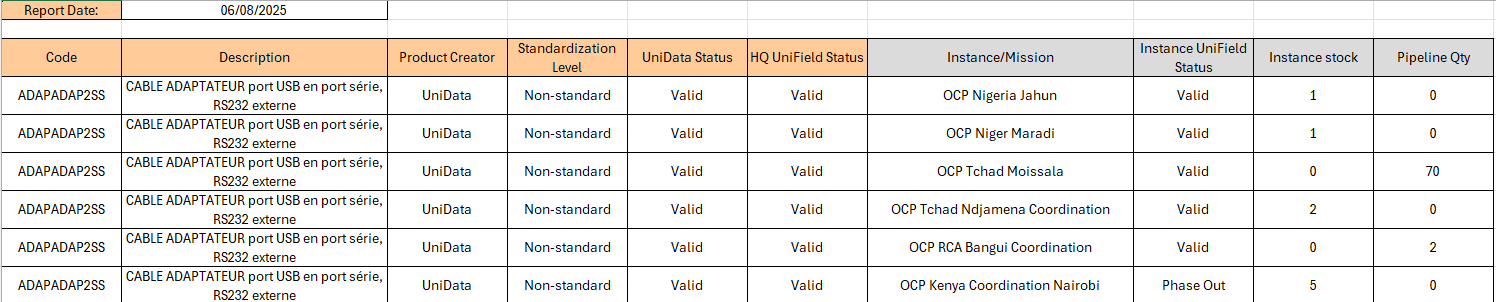
This report aims at displaying in which instance/s an individual product or a list of products is/are in Stock or in Pipe throughout the whole OC (it can be generated for example before proceeding to a BN/ED mass update). Therefore, the report can only be generated at HQ level.
The results give visibility of: Product Code, Description, Product Creator, Standardization level, UD status, UF status, Instances (name), Instance stock (qty) and Pipeline quantity (reminder: pipeline is calculated starting from a Validated PO line).
Report can be generated on screen or on Excel ( only on Excel for Product list).
Go to: Tools / Tools / Export Stock & Pipe Report
|
|
|
Export Stock & Pipe Report – on screen report (for 1 product) |
|
Export Stock & Pipe Report – excel export |
Supply User Manual ENG -> 5. Warehouse -> 5.16 LU-SU4302: Stock Inventory Reports -> I. PRODUCTS SITUATION REPORT
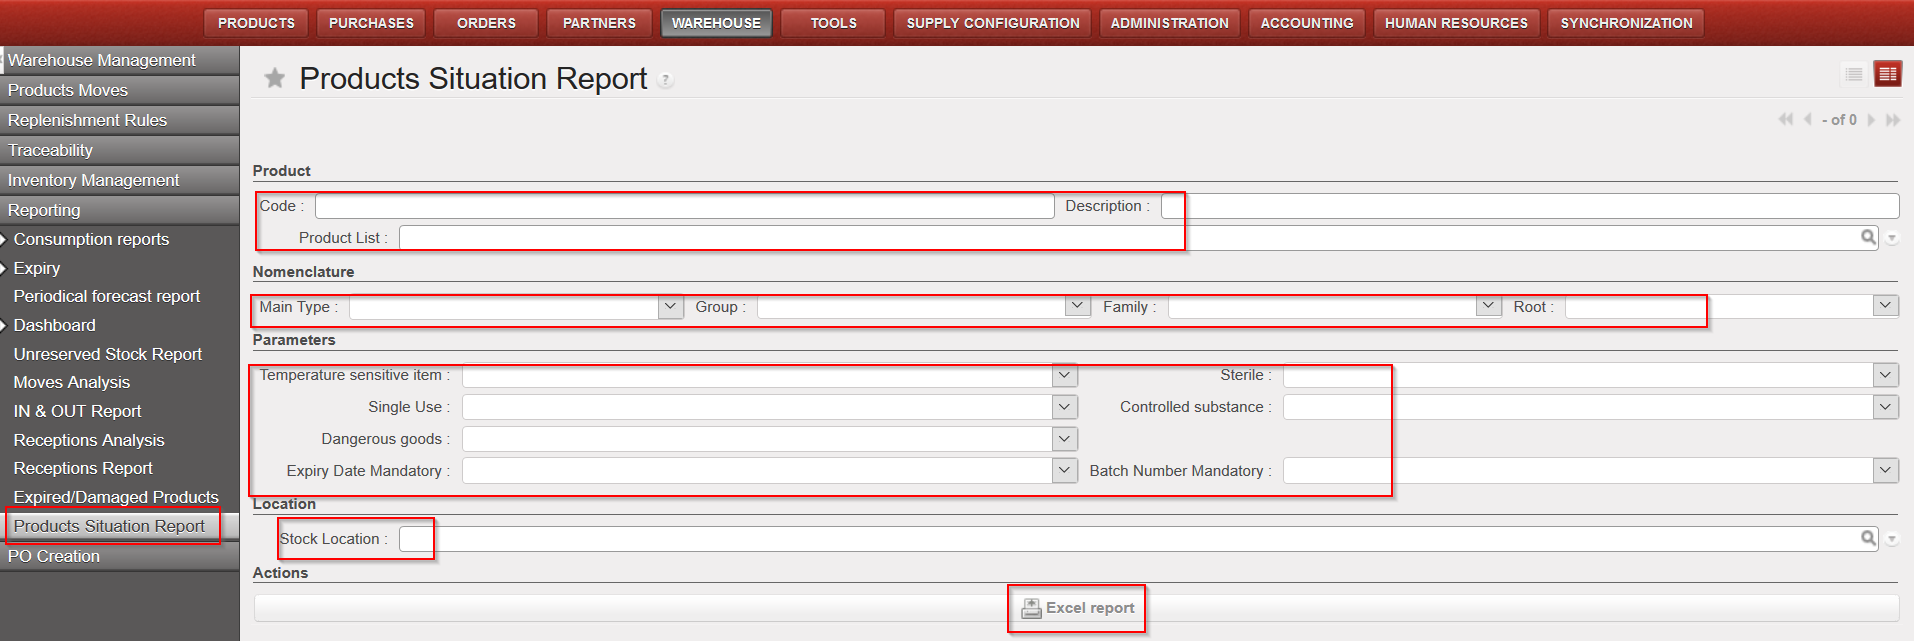
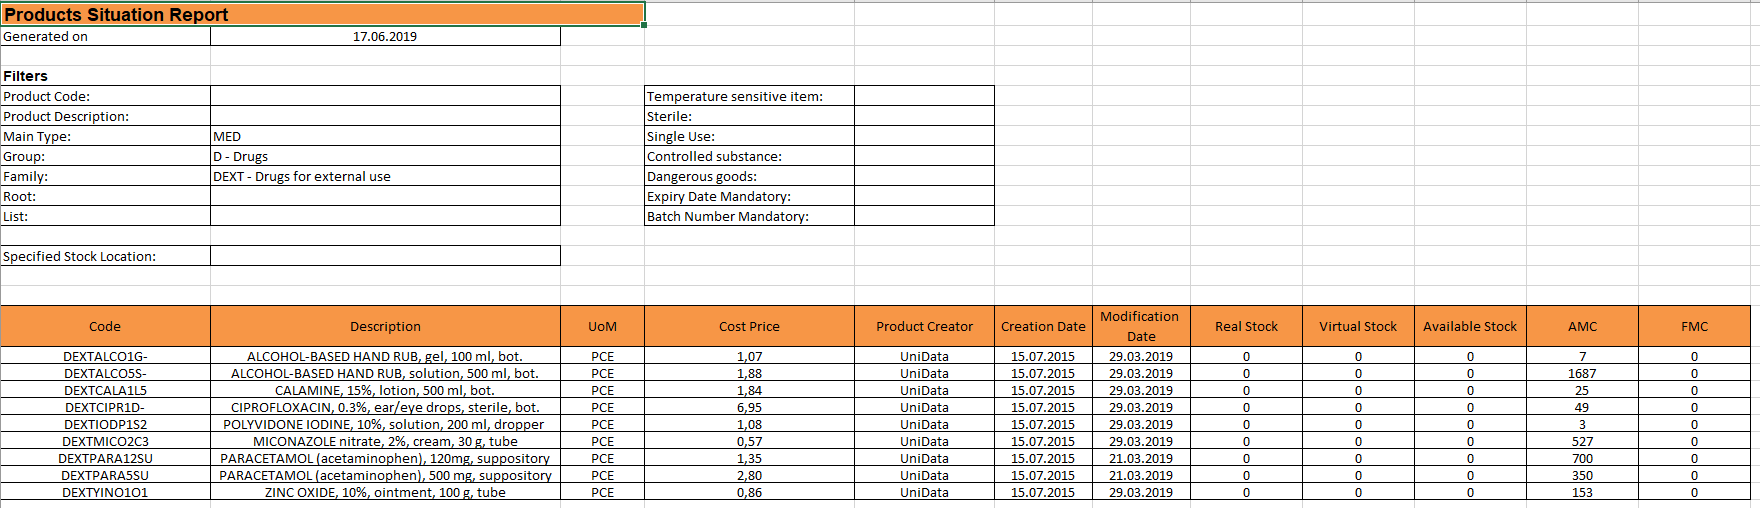
This report enables user to see the Real, Available and Virtual Stock as well as AMC and FMC for specific products with some refined filtering options, on products attributes for instance.
Go to: Warehouse / Reporting / Products Situation report
3. Click on “Excel report”
|
|
|
Products Situation report |
|
|
Please note that Real, Virtual and Available stock are calculated per location selected while AMC and FMC are always for whole instance.
If no location is selected then the Real, Virtual and Available stock will be for “MED/LOG” locations as per product form sheet.
Supply User Manual ENG -> 5. Warehouse -> 5.16 LU-SU4302: Stock Inventory Reports -> H. RESERVED PRODUCTS REPORT
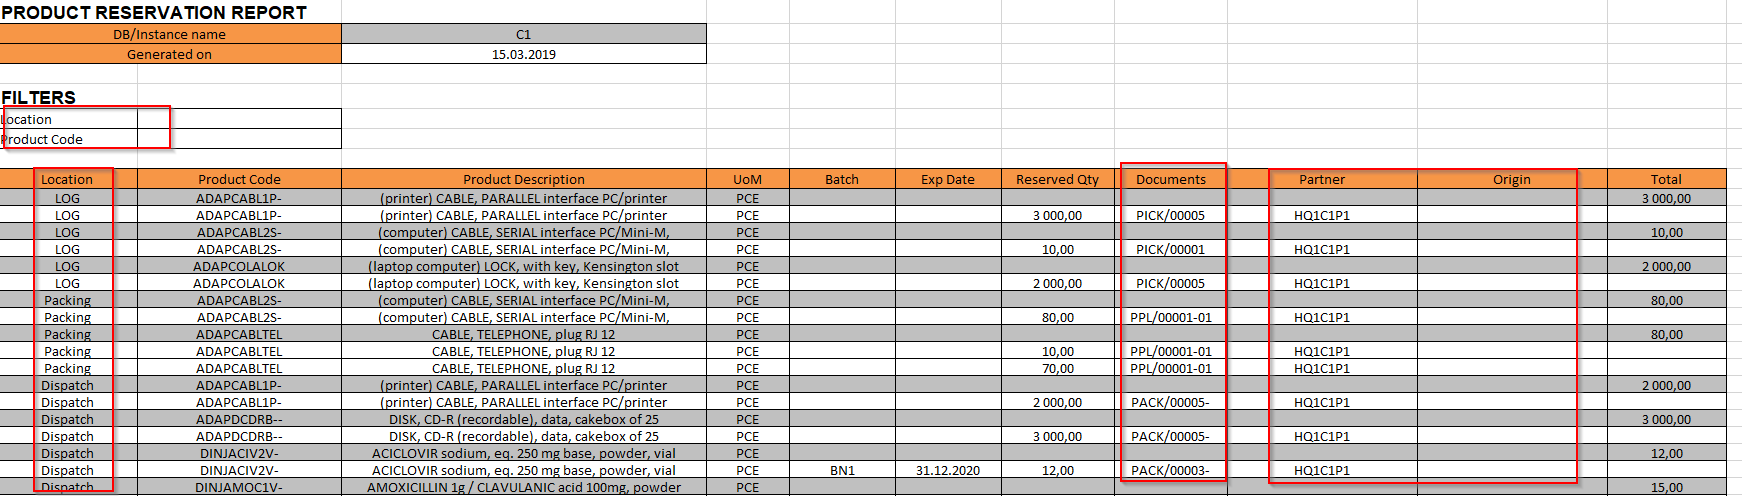
UniField allows you to check the stock levels for products which are allocated to different document: (OUT;Pick; INT; PPL and SHIP). Note that this report will not show the available stock.
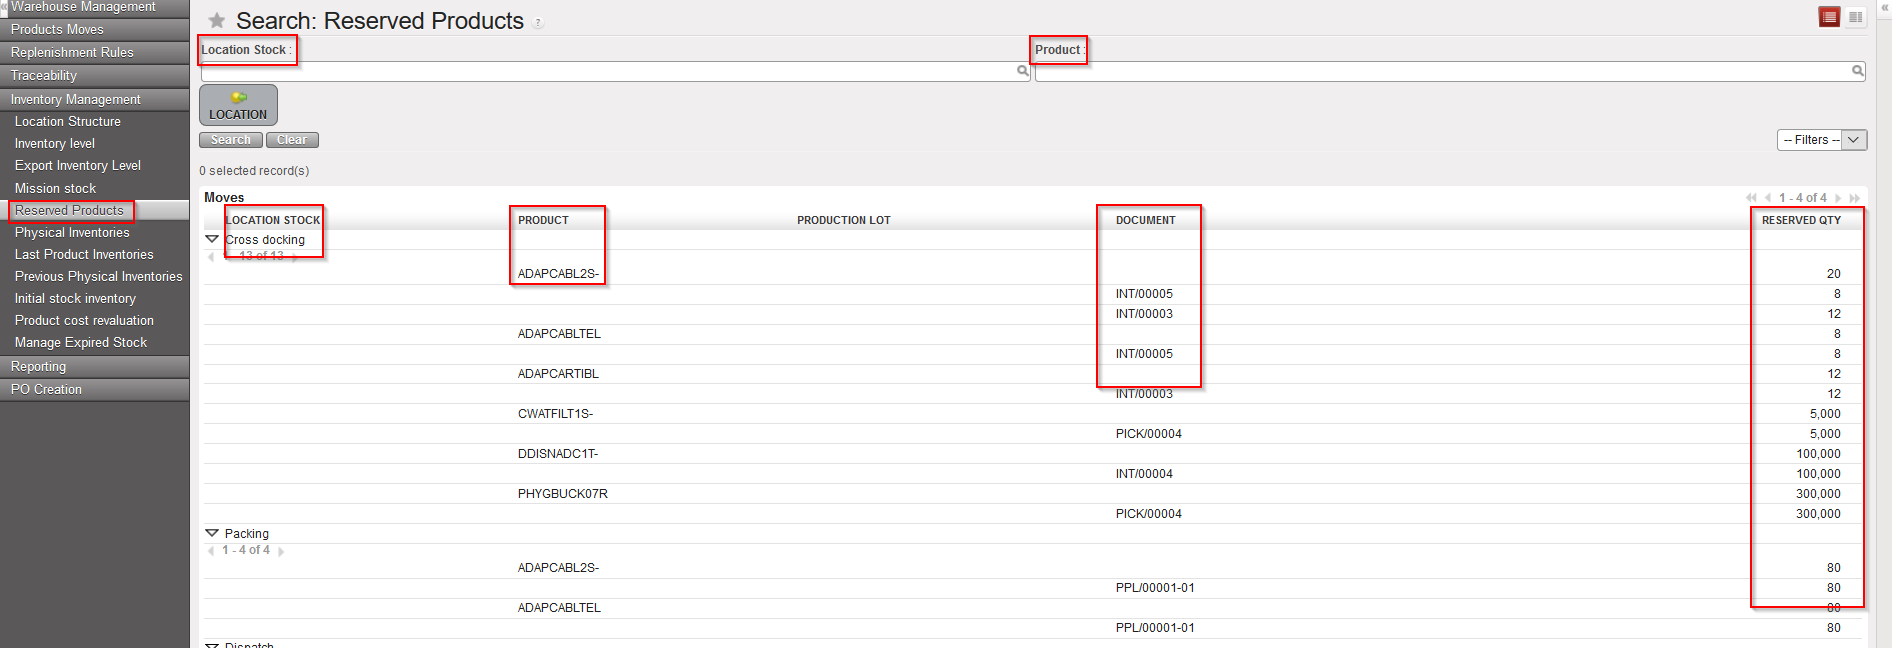
Go to: Warehouse / Inventory Management / Reserved Products
Filter can be set on “Location” or on “Product”.
The report displays the Location, Product and Reference of the Document on which products are allocated.
|
|
|
Reserved Products |
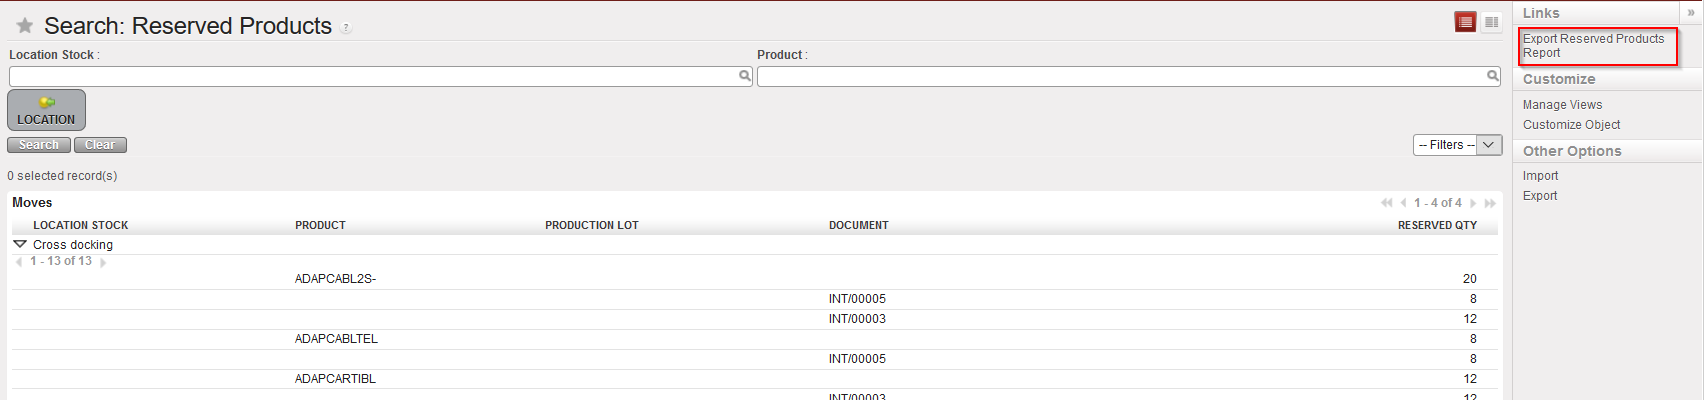
The report can also be Exported to an Excel file.
|
|
|
Link to generate reserved Stock Report in Excel |
|
|
|
Reserved Stock Report in Excel |
Please note that the “Partner” field is for FO while the “Origin” field is for requesting location of IRs.
Supply User Manual ENG -> 5. Warehouse -> 5.16 LU-SU4302: Stock Inventory Reports -> G. UNRESERVED STOCK REPORT
UniField allows you to check the stock levels in “Cross Docking” location for products that are not reserved; that is to say that these products have most certainly been Cancelled from a PICK or an OUT document (and sent to Cross Docking). This report is therefore supposed to help with the stock cleaning process.
Go to: Warehouse / Reporting / Unreserved Stock Report
|
|
|
Unreserved Stock Report |
The report will display the products with their BN/ED, if any, and their Quantity.